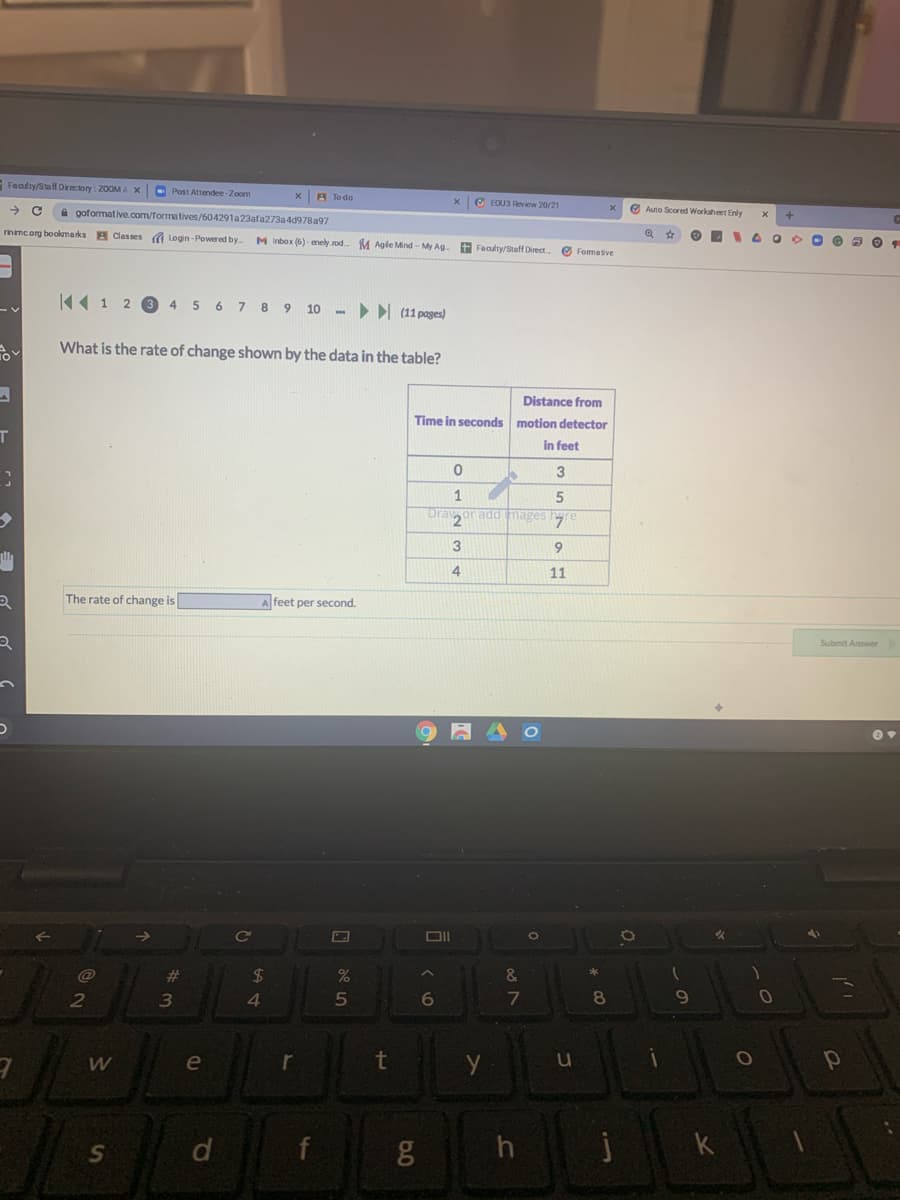
What is the rate of change shown by the data in the table? Distance from Time in seconds motion detector in feet 1 Draor add mages hyre 2 9. 4. 11 5.
Q: 5. Calculate the rate of change by analyzing the differences in the y-values and the differences in…
A: Rate of change can be found using following formula :
Q: 1 12 18 24 3. 4,
A:
Q: Suppose that a = b. %3D What is the rate of change of a with respect to b? Select one: O a? O 3b…
A: Here given that 13a3=b We have to find the rate of change of a with respect to b.
Q: A man is running around a circular track that is 200 m in circumference. An observer uses a…
A: a) The average rate of change of speed between 74s and 157s is: Answer(a): 4.82 m/s
Q: 8. What is the rate of decay, r (expressed as a decimal), for data best modeled by the exponentia…
A: Exponential growth curve equation is given by, Y= abx ............(1) Where a= starting value And…
Q: Find the average rate of change of the function ?(?) = 4?^3 on [1,6]
A:
Q: Find the average rate of change between the given values of the variable.…
A: Given: ft=5t2t=3t=3+h
Q: Question 11 > A 25-year-old woman burns 250 – 30t cal/hr while walking on her treadmill. Her caloric…
A: Calories decrease = calories intake -burned calories
Q: The number of crimes that occurred in a certain city per 1000 people had decreased from 45.3 in 1920…
A: Calculation:Compute the average rate of change as follows.
Q: Which of the following situations involves an average rate of change? a) The temperature dropped 4°C…
A: A child grew 2 cm in three years.
Q: A man is running around a circular track that is 200 m in circumference. An observer uses a…
A:
Q: What is the relative rate of change of r per unit change in n when n=10? 1 1 16 10 O Option 1 Option…
A: Consider a function fx. The relative rate of change of a function is defined as the ratio of the…
Q: A man is running around a circular track that is 200 m in circumference. An observer uses a…
A: Here in this question we need to find out the average speed of man in different time intervals. The…
Q: e range?
A: We are asked that how we can calculate the range of a function .
Q: What is the rate of change of the balance with respect to the number of deposits? A. $100 per…
A: Here we have, The graph of the linear function shown on the grid.
Q: A projectile is fired upwards from the ground. The height of the projectile above the ground is…
A:
Q: Find the rate of change in the percent of individuals free of headache pain over the given time span…
A:
Q: Given the function ?(?) = ? ^3 − 1 a. Find the average rate of change over the interval [−1,2] b.…
A: Given function is : fx=x3-1 (a) Find the average rate of change over the interval -1,2
Q: The water level of a lake is increasing by h cm every week. Time (week) 1 3 water level (h cm) 10.5…
A: Richardson extrapolation formula for derivative f'(x) =f(x+h) -f(x-h)2h
Q: A scuba tank started with 70 cubic feet of air and was empty after a 10-minute dive. ..... Assume…
A:
Q: 5. The concentration of a drug in the bloodstream t hours after the injection is given by is the…
A: C(t)=4.35 e-tRate of change of concentration;dCdt=ddt(4.35 e-t)dCdt=-4.35 e-tRate of change after 1…
Q: 4. What is the rate of change described by the points in the table? change in y/change in x) * -1/3…
A:
Q: Which equation represents instantenous rate of change in f when x = a: Average rate of change in f…
A: Given, instantenous rate of change in f when x = a: Average rate of change in f from a to x: Net…
Q: A man is running around a circular track that is 200 m in circumference. An observer uses a…
A:
Q: Enter the answer in the space provided. As a car comes to a stop, its speed gradually decreases. For…
A: The average rate of change is calculated by ax=fb-fab-a. From the given table, it is observed that…
Q: Bicycle Z O Bicycle Y 30 Bicycle Y 20 Bicycle X O Bicycle X 10 O Bicycle Z 1 3. 4 Time (seconds)…
A: Here we want to know faster rate of change
Q: Q. 12 Explain NRR .
A:
Q: What is the constant rate of change between the quantities in the table? Number of T-Shirts Total…
A:
Q: The table below gives the annual sales in millions of a product . What was the Average rate of…
A:
Q: Use the graph to answer #9 -10 9. Find the average rate of change over the interval 0<x <4
A: According to our guideline we can only answer first question and rest can be reposted.
Q: For the function shown in the figure below, find the average rate of change from (7,−9) and…
A:
Q: Find the average rate of change of g(a) = 3x -3 from a = -4 tox = 4. %3D > Next Question
A:
Q: A scuba tank started with 40 cubic feet of air and was empty after a 10-minute dive. Assume the rate…
A: We have to solve the table
Q: The number of crimes that occurred in a certain city per 1000 people had decreased from 45.3 in 1920…
A: Calculation:Compute the average rate of change as follows.
Q: How often was the mask rule violated 12 times per shift? ans = shifts What percent of the time was…
A:
Q: rate of change
A: It is given that an increase of 3 units change in t corresponds to 4 unit change in d. We have to…
Q: Liquid leaked from a damaged tank at a rate of r(t) liters per hour. The rate decreased as values of…
A:
Q: The initial bacterium count in a culture is 2300. A biologist later makes a sample count of bacteria…
A:
Q: Consider the figure below. E k(x) B (a) Between which pair of consecutive points is the average rate…
A:
Q: Consider the function. What is the approximate average rate of change of the function from…
A: Average rate of change is ratio of difference of output and difference of input.
Q: 1. Find the rate of change y 5 1 2 10 15 4 20 25
A: Given:
Q: A jet is approaching a radar station with a speed of 1,256 mph and a stable altitude of 9504ft. When…
A:
Q: (d) Let A(w) be as described in part (e). Find the rate of change of A wih respect tow when w6.
A:
Q: The surface of the sun has dark areas known as sunspots that are cooler than the rest of the sun’s…
A: As per guidelines, we are going to solve only one problem. So please repost the other problems…
Q: * 00 R a1gissod snuiod /L • Question 4 Find the average rate of change of g(x) = - 4x° - 5 from x =…
A:
Q: What is the average rate of change over 2 <I< 4? t 4 f(t) 1.8 3.4 4.6 6.4 8.4
A:
Q: • Question 6 Find the average rate of change of g(a) = - 5z + 5 from I = -3 to z = 2. Question Help:…
A:
Q: Question 3 Find the average rate of change of g(x) = – 4x - 3 from x = – 1 to I = 1 Question Help:…
A: To find the average rate of change of the function g(x) = - 4x3 - 3 From x =-1 to x =1
Q: 3. The number f of bacteria in a petri dish during an experiment can be modeled by the function A1)…
A:
Step by step
Solved in 3 steps
- Toward the middle of the harvesting season, peaches for canning come in three types, early, late, and extra late, depending on the expected date of ripening. During a certain week, the data to the right were recorded at a fruit delivery station. Complete parts (a) through (d) below. 40 trucks went out carrying early peaches; 71 carried late peaches; 52 carried extra late peaches; 26 carried early and late; 32 carried late and extra late; 11 carried early and extra late; 6 carried all three; 5 carried only figs (no peaches at all). a) How many trucks carried only late variety peaches? trucks (Type a whole number.) (b) How many carried only extra late? trucks (Type a whole number.) (c) How many carried only one type of peach? trucks (Type a whole number.) (d)How many trucks (in all) went out during the week? trucks (Type a whole number.)Reference: Camm J.D. et al., (2019) Business Analytics: descriptive, predictive and prescriptive (3rd edition). Cengage ____________________________________________________________________________________ Jay Gatsby categorizes wines into one of three clusters. The centroids of these clusters, describing the average characteristics of a wine in each cluster, are listed in the following table. Characteristic Cluster 1 Cluster 2 Cluster 3 Alcohol 0.819 0.164 -0.937 MalicAcid -0.329 0.869 -0.368 Ash 0.248 0.186 -0.393 Alcalinity…Toward the middle of the harvesting season, peaches for canning come in three types, early, late, and extra late, depending on the expected date of ripening. During a certain week, the data to the right were recorded at a fruit delivery station. Complete parts (a) through (d) below. 40 trucks went out carrying early peaches; 76 carried late peaches; 64 carried extra late peaches; 31 carried early and late; 34 carried late and extra late; 13 carried early and extra late; 6 carried all three; 8 carried only figs (no peaches at all). a. How many trucks carried only late variety peaches? b. How many carried only extra late? c. How many carried only one type of peach? d. How many trucks (in all) went out during the week? Thank you so much
- 4) Here are data on the lengths of male and female roaches (in mm). Your job is to find out if there is adifference between male and female roaches (this should be two sided - why?).males 15.4 13.9 12.7 9.6 6.6 10.7 9.9 13.3 16.2 9.0 11.4 16.6 12.2females 16.7 16.3 12.8 16.9 15.1 12.8 18.7 18.3 8.6 13.6 15.3 16.2 13.4It's up to you to figure out what the best procedure is, what kind of hypotheses to use, which α to use,what test to use, and so on. Make sure you follow all the appropriate steps. You should probably use Ras you’ll get done much quicker. Remember to very clearly state your results in writing. Never turn in just an R printout .Hint: how do you decide which test to use? What kind of distributions do the data have?Second-Hand Smoke: Data Set 12 “Passive and Active Smoke” in Appendix B includes cotinine levels measured in a group of nonsmokers exposed to tobacco smoke (n = 40, Mean = 60.58 ng>mL, s = 138.08 ng>mL) and a group of nonsmokers not exposed to tobacco smoke (n = 40, Mean = 16.35 ng>mL, s = 62.53 ng>mL). Cotinine is a metabolite of nicotine, meaning that when nicotine is absorbed by the body, cotinine is produced. Use a 0.05 significance level to test the claim that nonsmokers exposed to tobacco smoke have a higher mean cotinine level than nonsmokers not exposed to tobacco smoke. Construct the confidence interval appropriate for the hypothesis test in part a. What do you conclude about the effects of second-hand smoke?A paper investigated the driving behavior of teenagers by observing their vehicles as they left a high school parking lot and then again at a site approximately 1 2 mile from the school. Assume that it is reasonable to regard the teen drivers in this study as representative of the population of teen drivers. Amount by Which Speed Limit Was Exceeded MaleDriver FemaleDriver 1.2 -0.1 1.4 0.4 0.9 1.1 2.1 0.7 0.7 1.1 1.3 1.2 3 0.1 1.3 0.9 0.6 0.5 2.1 0.5 (a) Use a .01 level of significance for any hypothesis tests. Data consistent with summary quantities appearing in the paper are given in the table. The measurements represent the difference between the observed vehicle speed and the posted speed limit (in miles per hour) for a sample of male teenage drivers and a sample of female teenage drivers. (Use μmales − μfemales.Round your test statistic to two decimal places. Round your degrees of freedom down to the nearest whole number. Round your p-value to…
- A paper investigated the driving behavior of teenagers by observing their vehicles as they left a high school parking lot and then again at a site approximately 1 2 mile from the school. Assume that it is reasonable to regard the teen drivers in this study as representative of the population of teen drivers. Amount by Which Speed Limit Was Exceeded MaleDriver FemaleDriver 1.3 -0.1 1.3 0.4 0.9 1.1 2.1 0.7 0.7 1.1 1.3 1.2 3 0.1 1.3 0.9 0.6 0.5 2.1 0.5 (a) Use a .01 level of significance for any hypothesis tests. Data consistent with summary quantities appearing in the paper are given in the table. The measurements represent the difference between the observed vehicle speed and the posted speed limit (in miles per hour) for a sample of male teenage drivers and a sample of female teenage drivers. (Use μmales − μfemales.Round your test statistic to two decimal places. Round your degrees of freedom down to the nearest whole number. Round your p-value to…iven group data: Gp l1 l2 . f . 1 20 30 7 2 30 40 9 . Find: Midquartile 3 40 50 12 4 50 60 15 5 60 70 5 6 . 70 80 4Consider a hypothetical study that suggests that job satisfaction predicts the extent to which employees perform well on the job. A follow-up investigation supports the mechanism underlying this relationship: satisfied employees show up to work more energized, which in turn goes on to influence their performance. In the space below, match the variables in the study with the corresponding name. Independent variable a. Energy at work b. job performance c. job satisfaction d. This type of variable is not mentioned in this example Mediator variable a. Energy at work b. job performance c. job satisfaction d. This type of variable is not mentioned in this example
- Burger Dome sells hamburgers, cheeseburgers, French fries, soft drinks, and milk shakes, as well as a limited number of specialty items and dessert selections. Although Burger Dome would like to serve each customer immediately, at times more customers arrive than can be handled by the Burger Dome food service staff. Thus, customers wait in line to place and receive their orders. Suppose that Burger Dome analyzed data on customer arrivals and concluded that the arrival rate is 45 customers per hour and 1 customer processed per minute. Compare a multiple-server waiting line system with a shared queue to a multiple-server waiting line system with a dedicated queue for each server. Suppose Burger Dome establishes two servers but arranges the restaurant layout so that an arriving customer must decide which server's queue to join. Assume that this system equally splits the customer arrivals so that each server sees half of the customers. How does this system compare with the two-server…Suppose you are a production manager for a small firm that manufactures designer phone cases. Your production facility utilizes three machines. Quality is binary — each phone case is either defective or it is not defective. Each hour, Machines 1, 2, and 3 produce 10, 10 and 20 phone cases, respectively. But because the machines differ slightly in their technology, data on past production has shown that they differ in terms of their rates of defective output — specifically, Machines 1, 2, and 3 have rates of defective production of 2%, 4%, and 5%, respectively. If one phone case is selected randomly from one hour’s total output, and that phone case is found to be defective, what is the probability that it was produced by Machine 1? Machine 2? Machine 3?We are using the average bonuses paid to workers on Wall Street from 2000 to 2016 to fit different auto-regressive models. The data is provided below: Year Bonus($000) 2000 100.5 2001 74.1 2002 60.9 2003 99.9 2004 113.5 2005 149.8 2006 191.4 2007 177.8 2008 100.9 2009 140.6 2010 139.0 2011 111.4 2012 142.9 2013 169.8 2014 160.3 2015 136.8 2016 138.2 a. fit a third-order autoregressive model to the bonuses paid and test for the significance of the third-order autoregressive parameter (slope) (Use a = 0.05.) b. if necessary, fit a second-order autoregressive model to the bonuses paid and test for the significance of the second-order autoregressive parameter (slope). (Use a = 0.05.) c. if necessary, fit a first-order autoregressive model to the bonuses paid and test for the significance of the first-order autoregressive parameter (slope). (Use a = 0.05.) d. if…