What is the TOTAL producer surplus in the contact lens market?? I don't understand or know how to figure out the total producer surplus? PS- the graph and table reflect the contact lens market.
What is the TOTAL producer surplus in the contact lens market?? I don't understand or know how to figure out the total producer surplus? PS- the graph and table reflect the contact lens market.

Principles of Macroeconomics (MindTap Course List)
8th Edition
ISBN:9781305971509
Author:N. Gregory Mankiw
Publisher:N. Gregory Mankiw
Chapter7: Consumers, Producers, And The Efficiency Of Markets
Section: Chapter Questions
Problem 6PA

Related questions
Question
100%
What is the TOTAL
PS- the graph and table reflect the contact lens market.
Transcribed Image Text:Julio
Domestic Market: No Trade
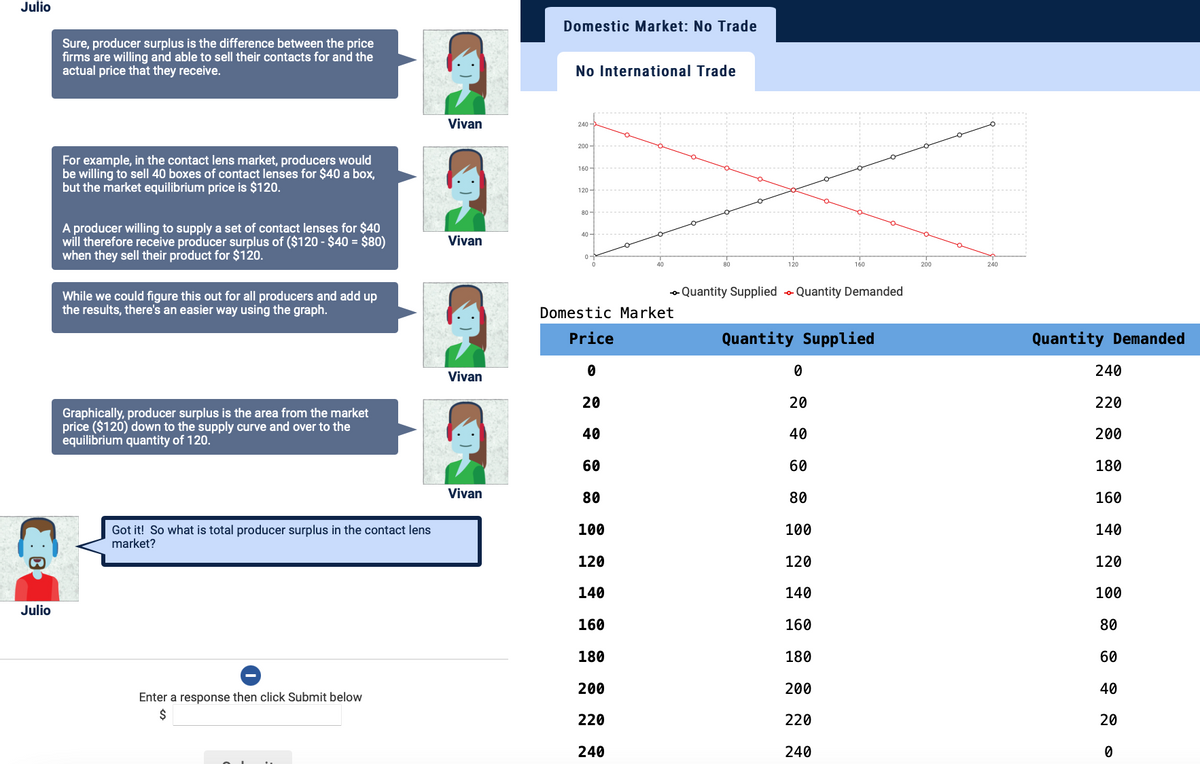
Sure, producer surplus is the difference between the price
firms are willing and able to sell their contacts for and the
actual price that they receive.
No International Trade
Vivan
240 -
200 -
For example, in the contact lens market, producers would
be willing to sell 40 boxes of contact lenses for $40 a box,
but the market equilibrium price is $120.
160 -
120 -
80 -
A producer willing to supply a set of contact lenses for $40
will therefore receive producer surplus of ($120 - $40 = $80)
when they sell their product for $120.
40 -
Vivan
0-
120
160
200
o Quantity Supplied - Quantity Demanded
While we could figure this out for all producers and add up
the results, there's an easier way using the graph.
Domestic Market
Price
Quantity Supplied
Quantity Demanded
240
Vivan
20
20
220
Graphically, producer surplus is the area from the market
price ($120) down to the supply curve and over to the
equilibrium quantity of 120.
40
40
200
60
60
180
Vivan
80
80
160
100
100
140
Got it! So what is total producer surplus in the contact lens
market?
120
120
120
140
140
100
Julio
160
160
80
180
180
60
200
200
40
Enter a response then click Submit below
220
220
20
240
240
Expert Solution
This question has been solved!
Explore an expertly crafted, step-by-step solution for a thorough understanding of key concepts.

This is a popular solution!

Trending now
This is a popular solution!

Step by step
Solved in 2 steps

Knowledge Booster


Learn more about
Need a deep-dive on the concept behind this application? Look no further. Learn more about this topic, economics and related others by exploring similar questions and additional content below.Recommended textbooks for you
Principles of Macroeconomics (MindTap Course List)
Economics
ISBN:
9781305971509
Author:
N. Gregory Mankiw
Publisher:
Cengage Learning

Principles of Economics (MindTap Course List)
Economics
ISBN:
9781305585126
Author:
N. Gregory Mankiw
Publisher:
Cengage Learning

Principles of Microeconomics (MindTap Course List)
Economics
ISBN:
9781305971493
Author:
N. Gregory Mankiw
Publisher:
Cengage Learning
Principles of Macroeconomics (MindTap Course List)
Economics
ISBN:
9781305971509
Author:
N. Gregory Mankiw
Publisher:
Cengage Learning
Principles of Economics (MindTap Course List)
Economics
ISBN:
9781305585126
Author:
N. Gregory Mankiw
Publisher:
Cengage Learning
Principles of Microeconomics (MindTap Course List)
Economics
ISBN:
9781305971493
Author:
N. Gregory Mankiw
Publisher:
Cengage Learning

Principles of Macroeconomics (MindTap Course List)
Economics
ISBN:
9781285165912
Author:
N. Gregory Mankiw
Publisher:
Cengage Learning

Essentials of Economics (MindTap Course List)
Economics
ISBN:
9781337091992
Author:
N. Gregory Mankiw
Publisher:
Cengage Learning

Principles of Economics, 7th Edition (MindTap Cou…
Economics
ISBN:
9781285165875
Author:
N. Gregory Mankiw
Publisher:
Cengage Learning