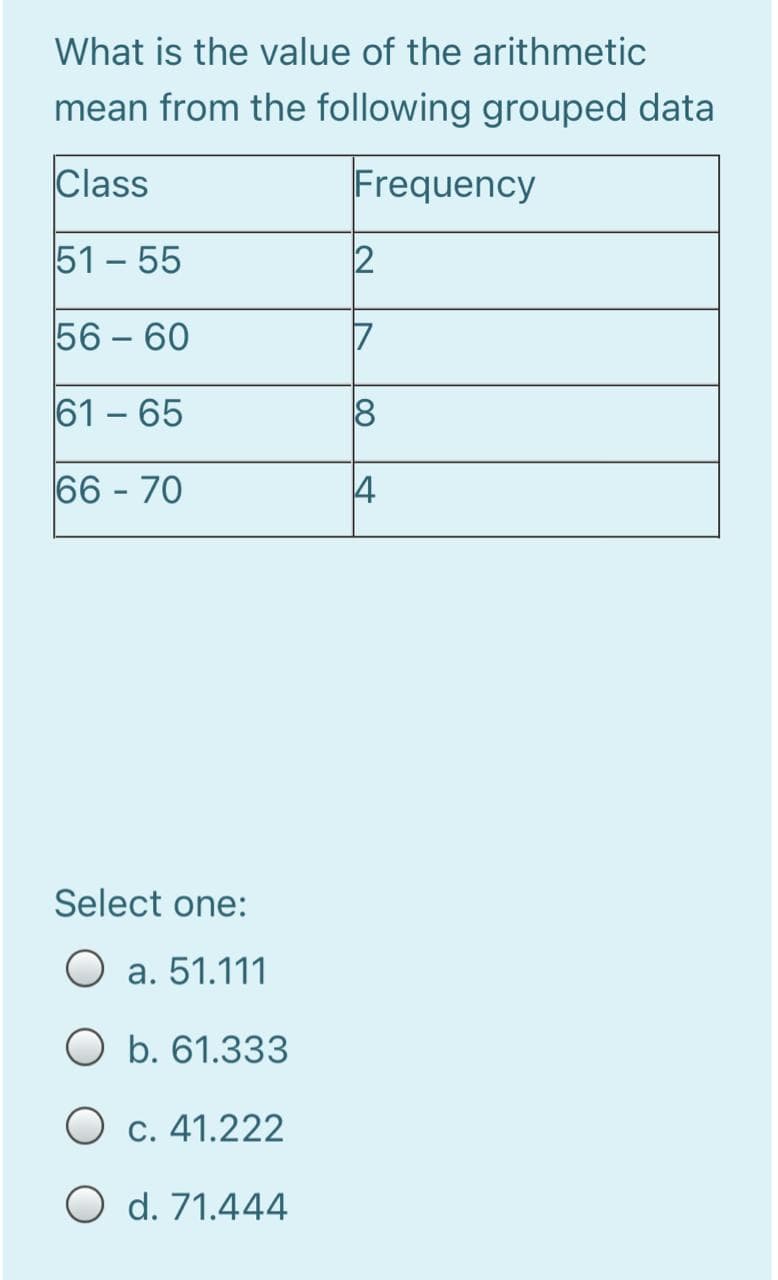
What is the value of the arithmetic mean from the following grouped data Class Frequency 51 - 55 56 - 60 61 - 65 8 66 - 70 4 2.


Q: What is the mean for the following scores? Scores: 4, 6, 14
A: For a set random variable X of size n, the mean is defined as x̅ = ΣX/n.
Q: Calculate the arithmetic mean, geometric mean, median and mode for the following data…
A: mean ∑xiN=5+4+3+10+13+1+6+17+28+22+1010=11910=10.8181 geometric mean…
Q: find out the arithmetic mean for given data 69,98,87,74,45,62,36,54,12,14
A: We have given that The data are 69,98,87,74,45,62,36,54,12,14
Q: The following refer to the following data set: 87 87 20 58 27 90 25 71 34 32 26 What is the mean…
A: Given, 87, 87, 20, 58, 27, 90, 25, 71, 34, 32, 26 The ascending order of the data is as follows:20,…
Q: Find the mean, median and mode of the given grouped data. Classes f 11-22 2…
A: Calculate Mean, Median, Mode from the following grouped data Class Frequency 11 - 22 2 23 -…
Q: The following refer to the following data set: 40 55 80 31 85 83 67 56 55 37 89 What is the mean…
A:
Q: 1. Find the mean, median, mode, and range for the following data 6, 7,9, 7, 8, 10, 11, 6, 7, 11, 12,…
A:
Q: Find the geometric and harmonic mean of the data 256,46,45,554,356,37,895,38,753,965,35,854, 567
A: Geometric Mean : The geometric mean is a measure of central tendency, but it is a type of a less…
Q: Given the following data: 8, 3, 3, 17, 9, 22, 19, find the mean.
A: Given data: 8, 3, 3, 17, 9, 22, 19
Q: On a certain civil service examination, the grades of five people were 71, 73, 74, 86, and 96.…
A: The mean is the average of all the values or it is the sum of all the values divided by the number…
Q: Find the mean, median, and mode for the following data set: 28 -31 28 0 31 31 -23 Find the mean,…
A: As per bartleby guideline expert have to answer first question only dear student please upload other…
Q: Find the mean of the following sets of data.
A:
Q: The median for the given set of six ordered data values is 28.5. 9 12 21 41 51 What is the missing…
A: The objective is to find the missing value.
Q: Find the median and mode for the data in the table below: interval frequency 0-10 10-20 20-30 4…
A:
Q: The median for the given set of six ordered data values is 32.5. 9 12 25_ 41 48 What is the missing…
A:
Q: find mean and mode for given data 12,32,65,56,45,2,112,15,12,14,16,12,85,64,37
A:
Q: Here is the second data set. 61 49 22 63 66 58 22 92 93 59 What is the mean (¯xx¯) of this data…
A:
Q: The following refer to the following data set: 61 51 28 82 71 73 31 39 95 51 45 What is the mean (x)…
A: Arrange the all observations in ascending order. 28,31,39,45,51,51,61,71,73,82,95 n= 11 = Number of…
Q: The following refer to the following data set: 85 78 55 58 47 96 33 43 58 37 73 What is the mean…
A: Given data set, 85 78 55 58 47 96 33 43 58 37 73 a)Mean= sum of observations/Total no of…
Q: For this grouped data set: Scores | Frequencies 30-34 | 7 25-29 |…
A: The table shows the calculations required for obtaining the mean: Class(1) Frequency (f)(2) Mid…
Q: The following data set belongs to a population: 5 -7 2 0 -9 16 10 7 Calculate the mean,median and…
A: Data Set - 5, -7, 2, 0, -9, 16, 10, 7 Total number of data values = n = 8
Q: For the following list of scores, what are the correct mean, median, & mode? Scores: 7, 9, 15,…
A: given data; Scores: 7,9,15,13,8,9 Scores: 7,8,9,9,13,15 ( in ascending order) number of…
Q: For what kinds of data is the arithmetic mean inappropriate?
A:
Q: Find the mean, median, and mode for the following grouped data. Interval Frequency 100-109 7 110-119…
A:
Q: The table below lists the populations, in thousands, of several rural western countries. What is…
A: Mean is the average value of the observations.
Q: The following refer to the following data set: 28 59 59 96 61 92 26 90 87 66 What is the mean () of…
A: In ascending order, 26 28 59 59 61 66 87 90 92 96
Q: The ages of the 112 people who have a car injured are classified as follows: Class Frequency 0- 9 10…
A: The average comes under the concept of measure of central tendency. This average is used to…
Q: Compute the arithmetic mean, geometric mean, harmonic mean, median, mode, sd, range, and variance…
A: Note: According to Bartleby expert guidelines, we can answer only first question with their three…
Q: approximate the mean of the grouped data 135-139: 7 140-144: 16 145-149: 12 150-154: 10…
A: Class interval and the corresponding frequencies are given. Class Interval Frequency 135-139 7…
Q: We are going to calculate the mean, median, and mode for two sets of data. Please show your answer…
A:
Q: The following table records the results of a survey that asked respondents how many cats lived in…
A: Find mean, harmonic mean and geometric mean
Q: The table below shows the overtime hours of the employees during a week. Overtime hours 0 1 2 3 4 5…
A:
Q: The median for the given set of six ordered data values is 30.5. 5 12 25 41 49 What is the missing…
A: We have given that The data are 5,12,25,missing number,41,49 Median=30.5 n=6
Q: The following refer to the following data set: 92.2 119.4 119.4 72.8 88.2 119.4 88.9 99.6 109.4 96…
A: Since you have posted multiple questions, we will solve the first question for you. If you want any…
Q: Find the mean, median, and mode for the following set of data. 3.1, 4.3, 3.9, 4.0, 4.2, 4.1, 32.0,…
A:
Q: The following refer to the following data set: 63 53 32 37 60 66 80 50 32 46 39 What is the mean…
A:
Q: Consider the data set 1, 8, 5, 2, 5, 3 ,2 ,1, 7, 1 ,2 1.Find the average (mean) (round to two…
A: Given 1, 8, 5, 2, 5, 3 ,2 ,1, 7, 1 ,2
Q: The following refer to the following data set: 41 56 41 97 96 34 95 52 23 67 What is the mean…
A: From the given information, the data set is, 41 56 41 97 96 34…
Q: What patterns does the calculation tell you about within the mean, how is it useful? Does it make…
A: Mean, median, mode are measures of central tendency, and the standard deviation is the measure of…
Q: What is the mean (¯xx¯) of this data set? mean = 62.8 What is the median of this data set? median…
A: Given data set, 75 95 72 67 39 98 28 44 48 72 53 Total number of values in data set n = 11…
Q: Please find the mean, median and mode of the following data set.
A: Provided data set is: 71, 79, 84, 84, 88, 90, 91, 93, 95, 98. Data is in increasing order. Number of…
Q: The following refer to the following data set: 104.9 67.7 86.6 76.1 82 96.4 77 104.9 85.2 104.9 What…
A: From the provided information, The arithmetic mean of the data can be obtained as:
Q: Calculate the Mean, Median and Model numbers of persons per house from the data!
A: Given No. of persons per house No. of houses 1 23 2 110 3 125 4 95 5 60 6 40 7 25…
Q: Which symbol is used for population mean?
A: Here use symbols of statistics and basic of sampling distribution
Q: What is the mean of following data. 23,24,56,87,99
A:
Q: The föllowing refer to the following data set: 22 82 23 20 58 20 34 63 31 98 99 What is the mean (z)…
A: The sorted dataset is given by, 20, 20, 22, 23, 31, 34, 58, 63, 82, 98, 99 number of observations =…
Q: Find the mean and median from the frequency table below. If necessary, round your answer to 2…
A: Given data: Data (x) Frequency (f) 29 4 30 5 32 2 35 3 36 16
Q: Fill in the question mark following the proper way of computing mean median and mode 2. MODE=2 10 13…
A: 3,5,3,2 Mode is most frequently occurring item Mode =3 8,10, --,13 Missing value =mean *4 –(other…
Q: mode of the quiz scores summarized below: Score Frequency 7 4 8 6 9 7
A:


Trending now
This is a popular solution!

Step by step
Solved in 2 steps

- True or False Label each of the following statement as either true or false. 1. Parity check schemes will always detect the position of an error.Suppose the probability of erroneously transmitting a single digit is P=0.03. Compute the probability of transmitting a 4-bit code word with (a) at most one error, and (b) exactly four errors.The following data are for the throughput, as measured by the number of wafer lots produced per day by different operators (A, B, C, and D) on different machines (each operator used each machine on two different days): Eighty-four working days were needed to collect the data. The numbers in parentheses refer to the days on which the results were obtained. For example, on the first day, operator A produced 17 lots using machine 2, and on the 84th day, operator A produced 18 lots using machine 5. On some days (such as the third day), more than one item of data was collected, and on other days (such as day 40), no data was collected. Analyze the data, stating all assumptions and conclusions.
- The management of the local zoo wants to know if all of their animal exhibits are equally popular. If there is significant evidence that some of the exhibits are not being visited frequently enough, then changes may need to take place within the zoo. A tally of visitors is taken for each of the following animals throughout the course of a week, and the results are contained in the following table. At α=0.005, determine whether there is sufficient evidence to conclude that some exhibits are less popular than others. Animal Exhibits at the Zoo Elephants Lions/Tigers Giraffes Zebras Monkeys Birds ReptilesNumber of visitors 152 175 185 144 145 171 163 Step 2 of 4 : Calculate the expected value for the number of visitors for the birds exhibit. Enter your answer as a fraction or a decimal rounded to three decimal places. Step 3 of 4: Compute the value of the test statistic. Round any calculations to at least six decimals places and round your final answer to three…The management of the local zoo wants to know if all of their animal exhibits are equally popular. If there is significant evidence that some of the exhibits are not being visited frequently enough, then changes may need to take place within the zoo. A tally of visitors is taken for each of the following animals throughout the course of a week, and the results are contained in the following table. At α=0.025, determine whether there is sufficient evidence to conclude that some exhibits are less popular than others. Animal Exhibits at the Zoo Elephants Lions/Tigers Giraffes Zebras Monkeys Birds Reptiles Number of visitors 164 166 172 188 165 139 142 Copy Data Step 3 of 4 : Compute the value of the test statistic. Round any intermediate calculations to at least six decimal places, and round your final answer to three decimal places.All manual computations must be carried with four decimal accuracy. Nickel Savings and Loan wishes to compare the two companies it uses to appraise the value of residential homes. Nickel Savings selected a sample of 10 residential properties and scheduled both firms for an appraisal. The result reported in $000 are: Home Schadek BowyersA 235 228 B 210 205 C 231 219 D 242 240 E 205 198 F 230 223 G 231 227 H 210 215 i 225 222 J 245 245 At 0.025 level of significance, can it be concluded that Bowyers has a lower mean appraisal home value? Data File:Appraisals.xlsx Determine which of the following formulations of the hypotheses is most appropriate and enter the corresponding…
- The management of the local zoo wants to know if all of their animal exhibits are equally popular. If there is significant evidence that some of the exhibits are not being visited frequently enough, then changes may need to take place within the zoo. A tally of visitors is taken for each of the following animals throughout the course of a week, and the results are contained in the following table. At α=0.05, determine whether there is sufficient evidence to conclude that some exhibits are less popular than others. Animal Exhibits at the ZooElephants Lions/Tigers Giraffes Zebras Monkeys Birds ReptilesNumber of visitors 137 129 161 147 160 134 131 Step 3 of 4 : Compute the value of the test statistic. Round any intermediate calculations to at least six decimal places, and round your final answer to three decimal places. Step 4 of 4: Draw a conclusion and interpret the decision. (Reject or fail to reject, Is there enough evidence or not?)One common system of computing the grade point average (GPA) assigns 4 points to an A, 3 points to a B, 2 points to a C, 1 point to a D, and 0 points to an F. What is the GPA of a student who gets an A in a 3-credit course, a B in each of two 4-credit courses, a C in a 3-credit course, and a D in a 4-credit course? (Round to two decimal places) Group of answer choices 2.75 2.25 2.56 2.60the following data represent the amount of time (in minutes) a random sample of eight sample of students enrolled in sullivians intermediate algebra course spent on homework from Section 4.5, factoring polynials 48 88 57 109 121 93 71. Determine the standard devidion and interquartile range


