What is the value of the sample correlation coefficient for these data? Round your answer to at least three decimal places.
What is the value of the sample correlation coefficient for these data? Round your answer to at least three decimal places.

Linear Algebra: A Modern Introduction
4th Edition
ISBN:9781285463247
Author:David Poole
Publisher:David Poole
Chapter7: Distance And Approximation
Section7.3: Least Squares Approximation
Problem 31EQ

Related questions
Question
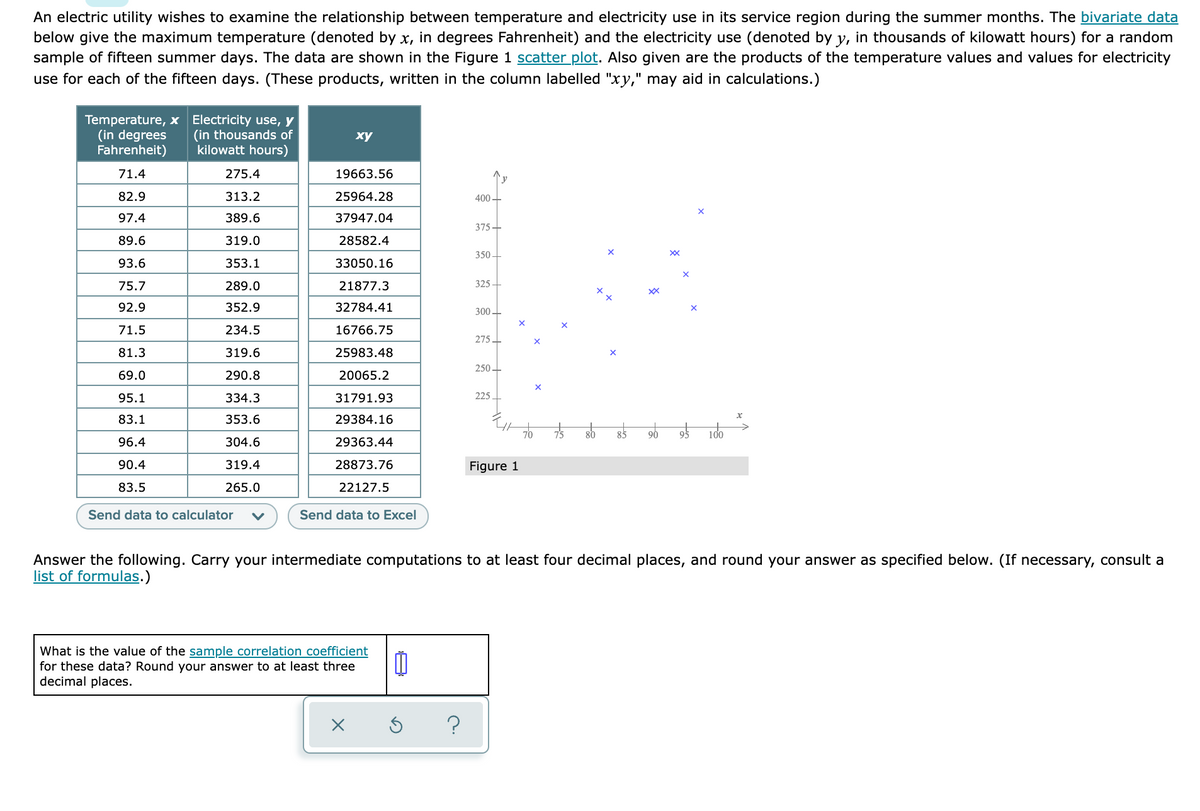
Transcribed Image Text:An electric utility wishes to examine the relationship between temperature and electricity use in its service region during the summer months. The bivariate data
below give the maximum temperature (denoted by x, in degrees Fahrenheit) and the electricity use (denoted by y, in thousands of kilowatt hours) for a random
sample of fifteen summer days. The data are shown in the Figure 1 scatter plot. Also given are the products of the temperature values and values for electricity
use for each of the fifteen days. (These products, written in the column labelled "xy," may aid in calculations.)
Temperature, x Electricity use, y
(in degrees
Fahrenheit)
(in thousands of
kilowatt hours)
ху
71.4
275.4
19663.56
y
82.9
313.2
25964.28
400 +
97.4
389.6
37947.04
375+
89.6
319.0
28582.4
350 -
93.6
353.1
33050.16
75.7
289.0
21877.3
325
XX
92.9
352.9
32784.41
300-
71.5
234.5
16766.75
2751
81.3
319.6
25983.48
250
69.0
290.8
20065.2
X
95.1
334.3
31791.93
225
83.1
353.6
29384.16
76 86 85 96 9 100
96.4
304.6
29363.44
90.4
319.4
28873.76
Figure 1
83.5
265.0
22127.5
Send data to calculator
Send data to Excel
Answer the following. Carry your intermediate computations to at least four decimal places, and round your answer as specified below. (If necessary, consult a
list of formulas.)
What is the value of the sample correlation coefficient
for these data? Round your answer to at least three
decimal places.
Expert Solution
This question has been solved!
Explore an expertly crafted, step-by-step solution for a thorough understanding of key concepts.

Step by step
Solved in 2 steps with 2 images

Recommended textbooks for you
Linear Algebra: A Modern Introduction
Algebra
ISBN:
9781285463247
Author:
David Poole
Publisher:
Cengage Learning

Glencoe Algebra 1, Student Edition, 9780079039897…
Algebra
ISBN:
9780079039897
Author:
Carter
Publisher:
McGraw Hill
Linear Algebra: A Modern Introduction
Algebra
ISBN:
9781285463247
Author:
David Poole
Publisher:
Cengage Learning
Glencoe Algebra 1, Student Edition, 9780079039897…
Algebra
ISBN:
9780079039897
Author:
Carter
Publisher:
McGraw Hill