What percent of those accused were from Haddington county?

Glencoe Algebra 1, Student Edition, 9780079039897, 0079039898, 2018
18th Edition
ISBN:9780079039897
Author:Carter
Publisher:Carter
Chapter10: Statistics
Section10.5: Comparing Sets Of Data
Problem 26PFA

Related questions
Question
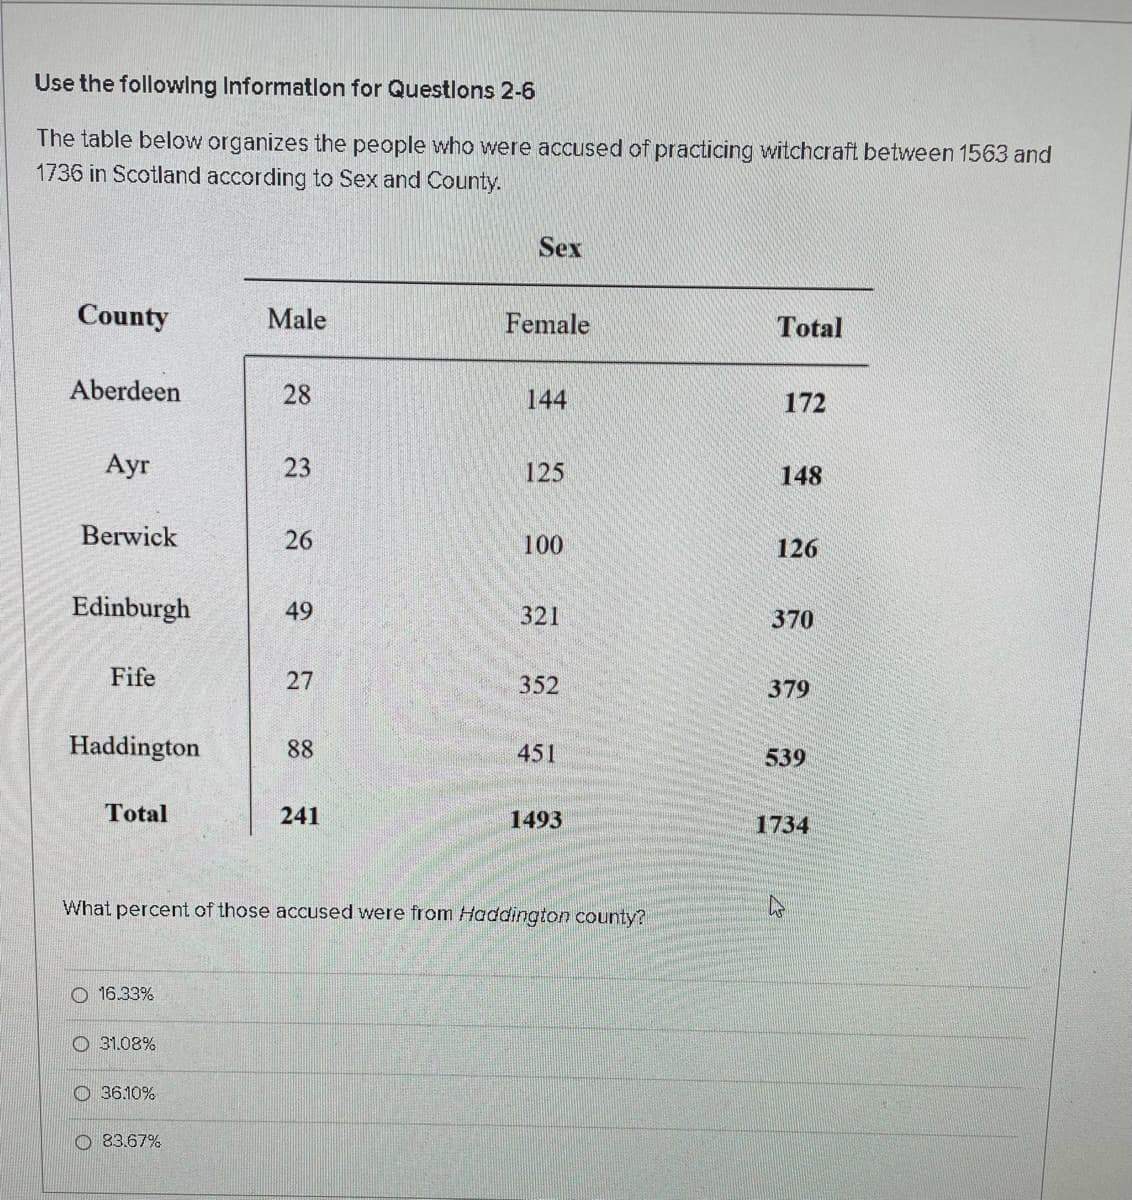
Transcribed Image Text:Use the following Information for Questlons 2-6
The table below organizes the people who were accused of practicing witchcraft between 1563 and
1736 in Scotland according to Sex and County.
Sex
County
Male
Female
Total
Aberdeen
28
144
172
Ayr
23
125
148
Berwick
26
100
126
Edinburgh
49
321
370
Fife
352
379
Haddington
88
451
539
Total
241
1493
1734
What percent of those accused were from Haddington county?
O 16.33%
O 31.08%
O 36.10%
O 83.67%
27
Expert Solution
This question has been solved!
Explore an expertly crafted, step-by-step solution for a thorough understanding of key concepts.

Step by step
Solved in 2 steps with 1 images

Recommended textbooks for you
Glencoe Algebra 1, Student Edition, 9780079039897…
Algebra
ISBN:
9780079039897
Author:
Carter
Publisher:
McGraw Hill
Glencoe Algebra 1, Student Edition, 9780079039897…
Algebra
ISBN:
9780079039897
Author:
Carter
Publisher:
McGraw Hill