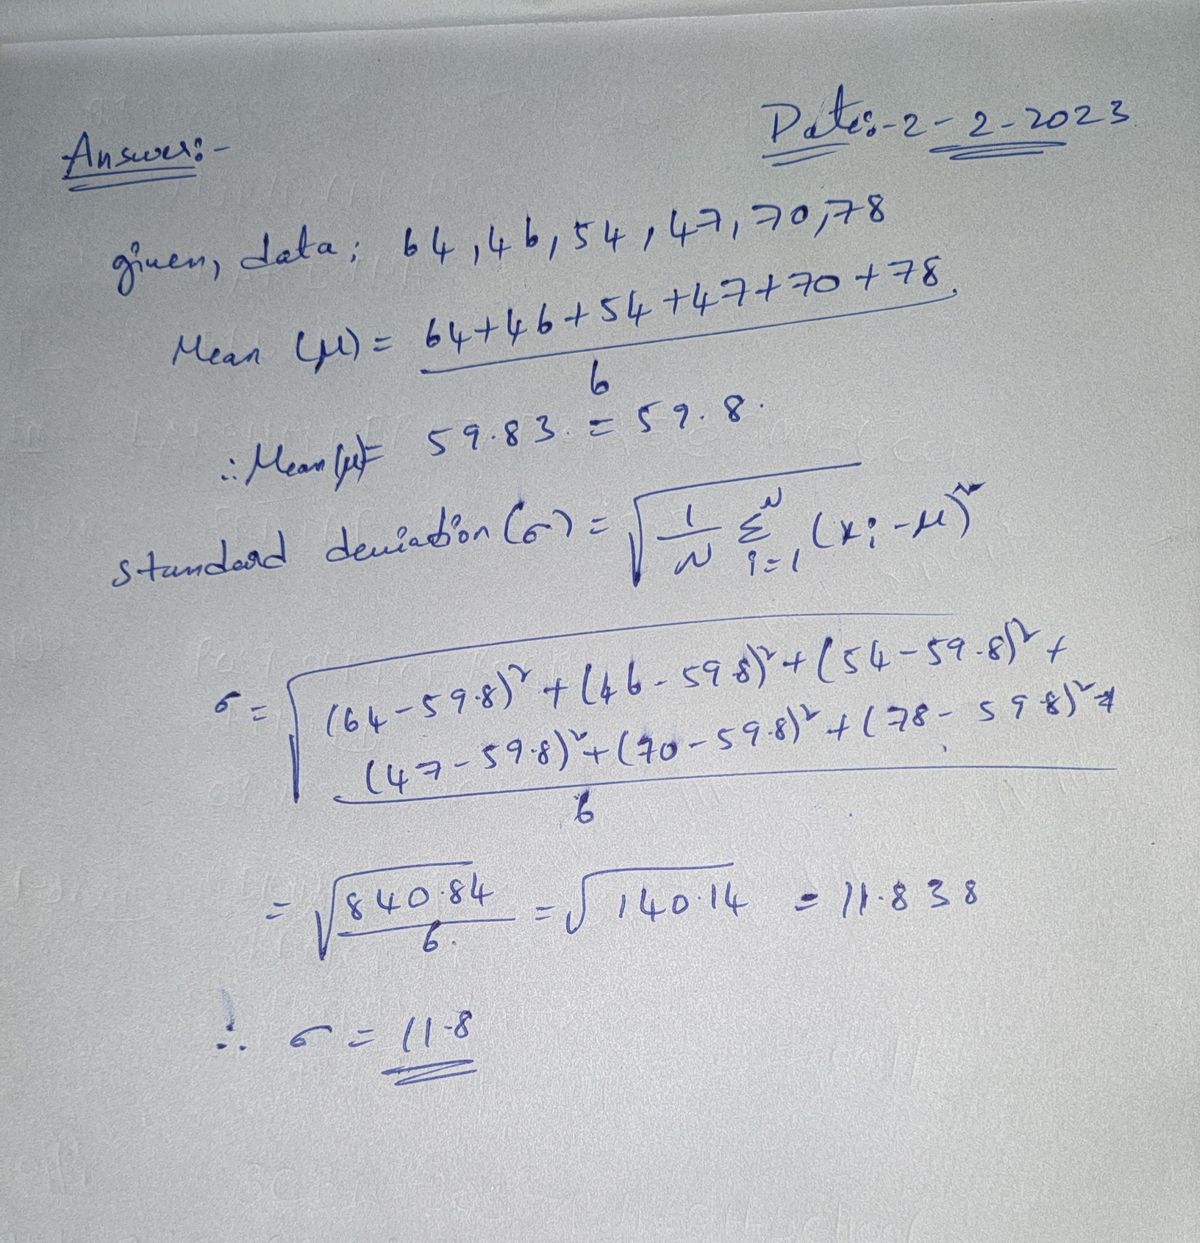
What percentage of presidents’ ages fall within one standard deviation of the mean? (Round to 1 decimal place.) Ages of Last 6 Presidents at Inauguration George Bush 64


Q: occurred most often? In how many classes were 2 students absent? How many times were no more than 2…
A: Answer:- Given ungrouped frequency table- Number of Absent Number of Classes 0 2 1 3 2 5…
Q: What is the Kruskal-Wallis test used for in statistics?
A: It is a rank based non-parametric test used for nominal and ordinal data (categorical data). It is…
Q: What is the variance of a set of 10 numbers: 2, 4, 4, 4, 5, 5, 7, 9, 9, 9?
A: data : 2, 4, 4, 4, 5, 5, 7, 9, 9, 9 no. of data (n) = 10 x x2 2 4 4 16 4 16 4 16 5…
Q: What is the relationship between a person's height and their weight in a sample of 1000 individuals?
A: A linear regression analysis was performed on the data, which showed a strong positive correlation…
Q: On a 5 question multiple-choice test, where each question has 3 answers, what would be the…
A: From the provided information, Total questions (n) = 5 Each question has 3 answers. Probability of…
Q: In your own words, explain the purpose of regression analyses.
A: Introduction The regression analysis (RA) is one of the major methods of statistical analysis.
Q: Bronco Truck Parts expects to sell the following number of units at the prices indicated under three…
A: Here given that A B C And 0.1, 0.5 0.4…
Q: The following graph shows the number T = T(d) of tornadoes in Oklahoma (F1/EF1 and stronger)…
A: (c) The objective is to find the average yearly rate of decrease in tornadic activity from 2011 to…
Q: the slope and the intercept of the best-fit line using the least-squares method with equal weights,…
A: I F 0 0.13 0.2 0.7 0.4 1.48 0.6 2.6 0.8 3.04 1 3.86 1.2 4.98 1.4 5.68 1.6 6.52…
Q: Measured value for n=20 identical specimen with a known recorded value of 2 are: 1.8, 2.2, 2.1, 2.3,…
A: Given data: 1.8 2.2 2.1 2.3 2.1 2.2 2.1 2.1 1.8 1.9 2.4 2.0 1.9 1.9…
Q: A study was conducted to determine if a new weight loss pill is effective. The null hypothesis is…
A: given data H0 : μ = 0Ha : μ > 0 n = 100 x¯ = 4σ = 2
Q: In a multiple regression analysis with three independent variables (X1, X2, and X3), what is the…
A: Multiple regression analysis is a statistical method used to examine the relationship between a…
Q: To answer item 17 to 23, use MS Excel data analysis Consider the following data set, in which a…
A: First enter the given data in Excel as shown below.
Q: In a particular bag of skittles, there are 9 red, 9 orange, 10 green, 12 yellow, and 15 purple…
A: GivenIn a bagNo.of red skittles=9No.of orange skittles=9No.of green skittles=10No.of yellow…
Q: Is it possible to recover the raw data from this table? What is the total number of absenteeism…
A: It is given that the ungrouped data showing the number of students absent in a statistics class.…
Q: In a simple linear regression model with one predictor variable, what is the coefficient of…
A: We have given that, the Pearson's correlation coefficient between the predictor and response…
Q: The waiting line at a popular bakery shop can be quite long. Suppose that the waiting time in…
A: The probability density function is,
Q: Accident Epidemiology Automobile accidents are a frequent occurrence and one of the leading causes…
A: As per given instructions i am solving part(a) and part (b) Given thatp = 6.5% = 0.065n = 24
Q: What is the range of values that the Spearman's rank correlation coefficient (ρ) can take?
A: The range of values that the Spearman's rank correlation coefficient (ρ) can take is between -1 and…
Q: company claims that 50% of their customers prefer product A, 30% prefer product B, and 20% prefer…
A: Given that Categories Observed=O Expected=E (O-E)2/E A 50 100 \times 0.5 = 50100×0.5=50…
Q: A researcher wants to determine if preschool attendance is associated with high school graduation…
A: Here we have to identify the correct response variable in this study
Q: We are given three strange coins. One has heads on both faces, the second has tails on both faces,…
A: Given information: Three coins are given.
Q: Find the steady state probability vector for the matrix. An eigenvector v of an n × n matrix A is a…
A: The given matrix is: A=1214012121201412=0.50.2500.50.50.500.250.5
Q: Problem 3.10. T-bill auction In a Treasury auction of Rs were submitted: Bidder 1 2 3 4 5 Bid Amount…
A:
Q: .The median is 2.The mode is 3.The mean is
A:
Q: Let X be a continuous random variable with mean μ and standard deviation σ. If X is transformed to Y…
A:
Q: QUESTION 7 Match each statement as an example of classical probability, empirical probability, or…
A: Subjective Probability: Anyone's opinion of the probability of an event. Classical Probability: All…
Q: For item 10 to 14. The following data were collected to determine the relationship between the…
A:
Q: 6. Ben has a theory that Californians weigh less than the average American man does. The average…
A: 6) Given Information: The average American man weighs 198 pounds. Ben has a theory that Californians…
Q: Why do we calculate the mean for the small group as 91.48/18
A: The total data in the small group with Q12 (1) is shown below ID Q11 Q12 4 4 1 5 3 1 6 2 1…
Q: A marketing research firm wants to determine if a new advertising campaign has an effect on sales.…
A: To calculate the p-value, the t-statistic of 2.7 and degrees of freedom of 20 can be used to look up…
Q: Which values are suspected outliers by the 1.5 × ???1.5 × ��� rule? Give your answer in the form…
A: The first quartile is 19, third quartile is 26.5.
Q: Consider a random variable X that follows a normal distribution with mean 100 and standard deviation…
A: Given: A random variable X that follows a normal distribution with mean 100 and standard deviation…
Q: If a sample has a variance of 9, what is the standard deviation of the sample?
A: The standard deviation of a sample is the square root of its variance. So, if a sample has a…
Q: d) Now assume that the uncertainty in each value of f grows with f: o(f) = 0.13 + 0.05 * f (MHz).…
A: Given the data as Current I(Amps) Frequency f (MHz) 0 0.13 0.2 0.7 0.4 1.48 0.6 2.6 0.8…
Q: A foreign car manufacturer advertises that its newest model, the Bullet, rarely stops at gas…
A: Given that: Total number of identical models of the Bullet in the study, n=50 Sample mean, x¯=30.4…
Q: A sample of 100 observations from a normal population has a mean of 50 and a standard deviation of…
A: The test statistic for this hypothesis test is calculated as follows: z = (50 - 48) / (10 /…
Q: answer all for upvote
A: Introduction A frequency shows the no. of times a data value occurred in a study.
Q: Giving a test to a group of students, the grades and ages are summarized below A C Total 4 27 18 34…
A: “Since you have posted multiple questions, we will provide the solutiononly to the first question as…
Q: The second question wasn't answered.
A: Probability is the measure of the chance that an event is likely to happen. It is calculated by…
Q: Consider a sample of 10 observations with the following values: 2, 4, 6, 8, 10, 12, 14, 16, 18, 20.…
A: To calculate the sample variance and standard deviation, we need to find the mean, variance and…
Q: Two samples are taken from different populations with the following sample means, sizes, and…
A: Given that Sample sizes n1=72 , n2=70 Sample mean=39 , 32 Standard deviation s1=5 , s2=4
Q: The numbers of students who passed or failed Professors Roth and Ahmadi’s courses last semester are…
A: Given Information: The given table is, Roth Ahmadi Total passed 258 172 430 failed 45 25 70…
Q: a. What is the probability of finding oil (to 2 decimals)? 0.60 b. After 200 feet of drilling on the…
A: Given that, P(high-quality oil) = 0.45 P(medium-quality oil) = 0.15 P(no oil) = 0.40 P(soil |…
Q: 21. Answer the following questions given the two histograms in Figure 7.5. rger standard deviation…
A: The objective is to compare the standard deviations and the means of both histograms. For the given…
Q: Define Dispersion?
A: Introduction Statistics is a field which involves collection, arrangement and analysis of the data…
Q: The comparison population is represented by the national statistics from 2009 with a population mean…
A: We have given the following data X : 13,13.5,15,14.25,14.5,14.25,13.25,16,16.75
Q: If Starbright Coffee Shop could get 1 more pound of coffee, which one should it be? What would be…
A: Given that, the objective of the company includes the maximization of total sales.
Q: Which of the Set A: 12, 27, 9, 18, 12, 21 Set B: 9, 14, 8, 11, 9, 12 Set A following data sets has…
A: Solution: First we find means and standard deviations for both the data sets. x (x-x)2 12…
Q: Suppose you roll a pair of six-sided dice and add their totals. The probabillity model is given…
A: Here given that The probabillity model is given below. Sum 2 3 4 5 6 7 8 9 10 11 12 Probabilty 1/36…
What percentage of presidents’ ages fall within one standard deviation of the mean? (Round to 1 decimal place.)
Ages of Last 6 Presidents at Inauguration
George Bush
64
Bill Clinton
46
George W. Bush
54
Barack Obama
47
Donald Trump
70
Joe Biden
78

Trending now
This is a popular solution!

Step by step
Solved in 2 steps with 2 images
