What percentage of variability in BAC is explained by the regression line? O Not enough information. O About 70%. O About 90%. O About 80%.
What percentage of variability in BAC is explained by the regression line? O Not enough information. O About 70%. O About 90%. O About 80%.

Glencoe Algebra 1, Student Edition, 9780079039897, 0079039898, 2018
18th Edition
ISBN:9780079039897
Author:Carter
Publisher:Carter
Chapter10: Statistics
Section10.6: Summarizing Categorical Data
Problem 10CYU

Related questions
Question
PLEASE HELP!!!
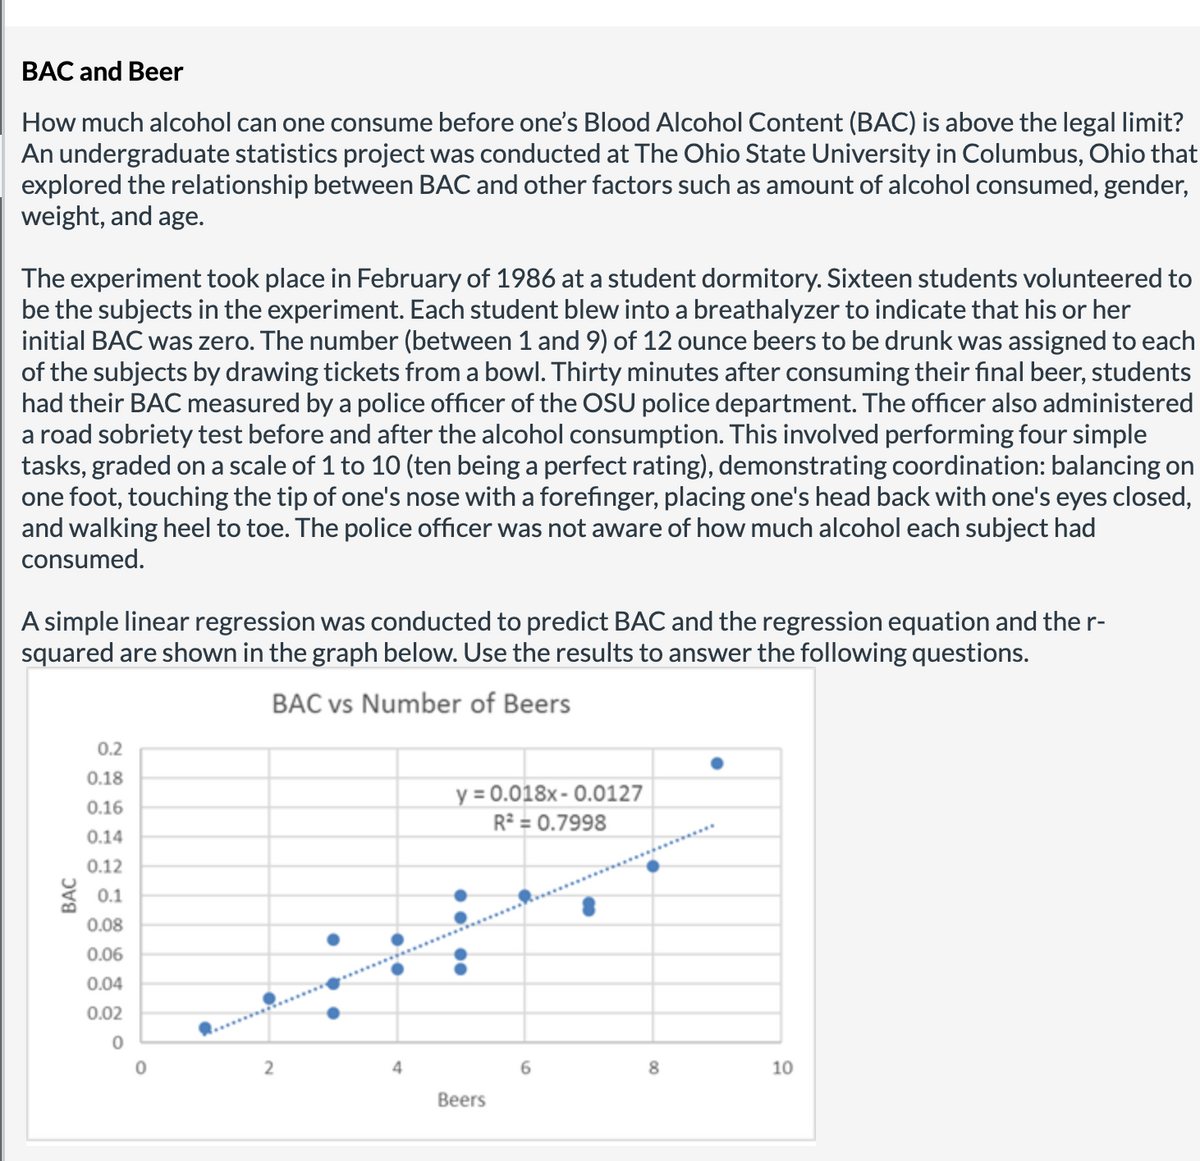
Transcribed Image Text:BAC and Beer
How much alcohol can one consume before one's Blood Alcohol Content (BAC) is above the legal limit?
An undergraduate statistics project was conducted at The Ohio State University in Columbus, Ohio that
explored the relationship between BAC and other factors such as amount of alcohol consumed, gender,
weight, and age.
The experiment took place in February of 1986 at a student dormitory. Sixteen students volunteered to
be the subjects in the experiment. Each student blew into a breathalyzer to indicate that his or her
initial BAC was zero. The number (between 1 and 9) of 12 ounce beers to be drunk was assigned to each
of the subjects by drawing tickets from a bowl. Thirty minutes after consuming their final beer, students
had their BAC measured by a police officer of the OSU police department. The officer also administered
a road sobriety test before and after the alcohol consumption. This involved performing four simple
tasks, graded on a scale of 1 to 10 (ten being a perfect rating), demonstrating coordination: balancing on
one foot, touching the tip of one's nose with a forefinger, placing one's head back with one's eyes closed,
and walking heel to toe. The police officer was not aware of how much alcohol each subject had
consumed.
A simple linear regression was conducted to predict BAC and the regression equation and the r-
squared are shown in the graph below. Use the results to answer the following questions.
BAC vs Number of Beers
0.2
0.18
y = 0.018x- 0.0127
R² = 0.7998
0.16
0.14
0.12
0.1
0.08
0.06
0.04
0.02
8
10
Вeers
ВАC
Transcribed Image Text:What percentage of variability in BAC is explained by the regression line?
Not enough information.
O About 70%.
O About 90%.
O About 80%.
Expert Solution
Step 1
The regression equation is y = 0.018x – 0.0127, where y defines the limit of Blood Alcohol Content and x defines the consumption of alcohol consumption.

Trending now
This is a popular solution!

Step by step
Solved in 2 steps

Recommended textbooks for you
Glencoe Algebra 1, Student Edition, 9780079039897…
Algebra
ISBN:
9780079039897
Author:
Carter
Publisher:
McGraw Hill

Holt Mcdougal Larson Pre-algebra: Student Edition…
Algebra
ISBN:
9780547587776
Author:
HOLT MCDOUGAL
Publisher:
HOLT MCDOUGAL

Big Ideas Math A Bridge To Success Algebra 1: Stu…
Algebra
ISBN:
9781680331141
Author:
HOUGHTON MIFFLIN HARCOURT
Publisher:
Houghton Mifflin Harcourt
Glencoe Algebra 1, Student Edition, 9780079039897…
Algebra
ISBN:
9780079039897
Author:
Carter
Publisher:
McGraw Hill
Holt Mcdougal Larson Pre-algebra: Student Edition…
Algebra
ISBN:
9780547587776
Author:
HOLT MCDOUGAL
Publisher:
HOLT MCDOUGAL
Big Ideas Math A Bridge To Success Algebra 1: Stu…
Algebra
ISBN:
9781680331141
Author:
HOUGHTON MIFFLIN HARCOURT
Publisher:
Houghton Mifflin Harcourt