What purpose does paragraph 8 serve in the text? A. It explains additional factors identified by the simulation. B. It outlines how the simulation models the problem.
What purpose does paragraph 8 serve in the text? A. It explains additional factors identified by the simulation. B. It outlines how the simulation models the problem.

Biology Today and Tomorrow without Physiology (MindTap Course List)
5th Edition
ISBN:9781305117396
Author:Cecie Starr, Christine Evers, Lisa Starr
Publisher:Cecie Starr, Christine Evers, Lisa Starr
Chapter18: The Biosphere And Human Effects
Section: Chapter Questions
Problem 4DID

Related questions

Concept explainers
Question
8
What purpose does paragraph 8 serve in the text?
A.
It explains additional factors identified by the simulation.
B.
It outlines how the simulation models the problem.
C.
It illustrates the results predicted by the simulation.
D.
It describes the variables used to create the simulation.
![6
7
8
9
Hunting
Culling
Number of Bison
Bison
Distribution
Weather
60001
5000
4000
3000
2000
Fire
1000
The model simulates the populations of the two main bison breeding herds in Yellowstone National Park as well as nine plant groups. Eight simulations spanning a period of 50 years
were completed using the model to determine whether Yellowstone bison had exceeded their food-limited carrying capacity inside the park. The simulations did not allow Yellowstone bison
to expand their range beyond the park boundaries. The simulations predicted the sizes of the two main herds by estimating the mean size of each herd, the median size of each herd, and
the possible range in the size of each herd. These data were then compared to actual 2005 population data for Yellowstone bison. The results of the simulations and the 2005 bison
population numbers are shown in figure 3.
Range
1820-3530
Median
Meant [2670
2417
Predation
Bison
Population
Plant
Population
Soils
Mean
3776
Range
2430-5630
Plant
Consumption
Median
4030
Water
Budget
1484
Figure 2 - Selected essential components of the
SAVANNA ecosystem model. Modified from White
et al. (2011)
3531
Simulation
Simulation
Results
2005
Population
2005
Population
Results
(Northern Herd) (Central Herd) (Northern Herd) (Central Herd)
Figure 3 - Simulation results and 2005 bison
population data. Data from White et al. (2011)
As shown, the simulated bison population was larger than the actual population in 2005. The actual population of the northern herd in 2005 was significantly smaller than the smallest
population predicted using the model, as well as smaller than the median and mean predictions. The smallest population size for the central herd predicted using the model was lower than
the actual size of the central herd in 2005. However, the mean, median, and maximum predicted size of the central herd population were all significantly greater than the actual size of the
central herd in 2005. These results suggest that actual bison numbers could have increased by approximately 200 to 2000 before the herd would have been in danger of exhausting its food
supply. Food availability was the limiting factor in the SAVANNA model, so if actual bison numbers had been higher than those predicted by the model, it would suggest that Yellowstone
bison had exceeded their food-limited carrying capacity inside the park. However, this was not the case. This led the researchers to conclude that the food-limited carrying capacity for the
Yellowstone bison had not been reached.
However, the model also suggested that carrying capacity could vary from year to year due to other factors aside from food availability, including weather and competition for resources.
Additionally, winter weather conditions resulting in deep snowpacks could limit the ability of Yellowstone bison to access food. Figure 2 shows that the model allows for the fact that weather
can affect plant consumption. If snow is extremely deep, bison may have trouble accessing the plants they need to survive. If they cannot obtain adequate nutrition during part of the year,
the bison population may decrease due to this temporary food shortage. Therefore, bison deaths due to starvation could occur even when bison numbers are well below the food-limited
carrying capacity.
Scientists have suggested several possible explanations for the movement of Yellowstone bison outside of the park even though they have not exceeded their food-limited carrying
capacity. Variations in the local climate are one possible factor. Areas outside of the park where snow melts sooner because the elevation is lower would provide better foraging
opportunities. The bison may also simply be expanding their range to reduce population density (the number of individuals in a specific area) and therefore lessen the competition for an
area's resources. This reduced competition and greater resource availability could have a positive effect on the Yellowstone bison's nutrition, reproduction, and survival.
References:
Coughenour, M. B. 2005. Spatial-dynamic modeling of bison carrying capacity in the Greater Yellowstone ecosystem: A synthesis of bison movements, population dynamics, and
interactions with vegetation. Natural Resource Ecology Laboratory, Colorado State University, Fort Collins, Colorado.
White, P., Plumb, G., Coughenour, M, and Wallen, R. "Carrying Capacity and Movements of Yellowstone Bison." Yellowstone Science 19.1 (2011). Web. 5. May. 2014 [Available from:
http://www.nps.gov/yell/planyourvisit/upload/YS_19_1_sm.pdf]](/v2/_next/image?url=https%3A%2F%2Fcontent.bartleby.com%2Fqna-images%2Fquestion%2F5ce6e0c7-25af-422c-b280-8368ab53432c%2F9d40c4bc-ecd1-47a6-99ce-282cadbf8de1%2Fuu64iel_processed.png&w=3840&q=75)
Transcribed Image Text:6
7
8
9
Hunting
Culling
Number of Bison
Bison
Distribution
Weather
60001
5000
4000
3000
2000
Fire
1000
The model simulates the populations of the two main bison breeding herds in Yellowstone National Park as well as nine plant groups. Eight simulations spanning a period of 50 years
were completed using the model to determine whether Yellowstone bison had exceeded their food-limited carrying capacity inside the park. The simulations did not allow Yellowstone bison
to expand their range beyond the park boundaries. The simulations predicted the sizes of the two main herds by estimating the mean size of each herd, the median size of each herd, and
the possible range in the size of each herd. These data were then compared to actual 2005 population data for Yellowstone bison. The results of the simulations and the 2005 bison
population numbers are shown in figure 3.
Range
1820-3530
Median
Meant [2670
2417
Predation
Bison
Population
Plant
Population
Soils
Mean
3776
Range
2430-5630
Plant
Consumption
Median
4030
Water
Budget
1484
Figure 2 - Selected essential components of the
SAVANNA ecosystem model. Modified from White
et al. (2011)
3531
Simulation
Simulation
Results
2005
Population
2005
Population
Results
(Northern Herd) (Central Herd) (Northern Herd) (Central Herd)
Figure 3 - Simulation results and 2005 bison
population data. Data from White et al. (2011)
As shown, the simulated bison population was larger than the actual population in 2005. The actual population of the northern herd in 2005 was significantly smaller than the smallest
population predicted using the model, as well as smaller than the median and mean predictions. The smallest population size for the central herd predicted using the model was lower than
the actual size of the central herd in 2005. However, the mean, median, and maximum predicted size of the central herd population were all significantly greater than the actual size of the
central herd in 2005. These results suggest that actual bison numbers could have increased by approximately 200 to 2000 before the herd would have been in danger of exhausting its food
supply. Food availability was the limiting factor in the SAVANNA model, so if actual bison numbers had been higher than those predicted by the model, it would suggest that Yellowstone
bison had exceeded their food-limited carrying capacity inside the park. However, this was not the case. This led the researchers to conclude that the food-limited carrying capacity for the
Yellowstone bison had not been reached.
However, the model also suggested that carrying capacity could vary from year to year due to other factors aside from food availability, including weather and competition for resources.
Additionally, winter weather conditions resulting in deep snowpacks could limit the ability of Yellowstone bison to access food. Figure 2 shows that the model allows for the fact that weather
can affect plant consumption. If snow is extremely deep, bison may have trouble accessing the plants they need to survive. If they cannot obtain adequate nutrition during part of the year,
the bison population may decrease due to this temporary food shortage. Therefore, bison deaths due to starvation could occur even when bison numbers are well below the food-limited
carrying capacity.
Scientists have suggested several possible explanations for the movement of Yellowstone bison outside of the park even though they have not exceeded their food-limited carrying
capacity. Variations in the local climate are one possible factor. Areas outside of the park where snow melts sooner because the elevation is lower would provide better foraging
opportunities. The bison may also simply be expanding their range to reduce population density (the number of individuals in a specific area) and therefore lessen the competition for an
area's resources. This reduced competition and greater resource availability could have a positive effect on the Yellowstone bison's nutrition, reproduction, and survival.
References:
Coughenour, M. B. 2005. Spatial-dynamic modeling of bison carrying capacity in the Greater Yellowstone ecosystem: A synthesis of bison movements, population dynamics, and
interactions with vegetation. Natural Resource Ecology Laboratory, Colorado State University, Fort Collins, Colorado.
White, P., Plumb, G., Coughenour, M, and Wallen, R. "Carrying Capacity and Movements of Yellowstone Bison." Yellowstone Science 19.1 (2011). Web. 5. May. 2014 [Available from:
http://www.nps.gov/yell/planyourvisit/upload/YS_19_1_sm.pdf]
Transcribed Image Text:Carrying Capacity and the Bison of Yellowstone National Park
The following text is adapted from an article in Yellowstone Science, a journal published by the National Park Service.
1
2
3
4
5
An important part of the Yellowstone National Park ecosystem, bison are the largest land mammals in North America. Yellowstone bison historically occupied approximately 7,720 square
miles (20,000 km²) in the headwaters of the Yellowstone and Madison rivers. Today, this range is restricted to primarily Yellowstone National Park and some adjacent areas of Montana. The
bison population is subdivided into the central and northern breeding herds.
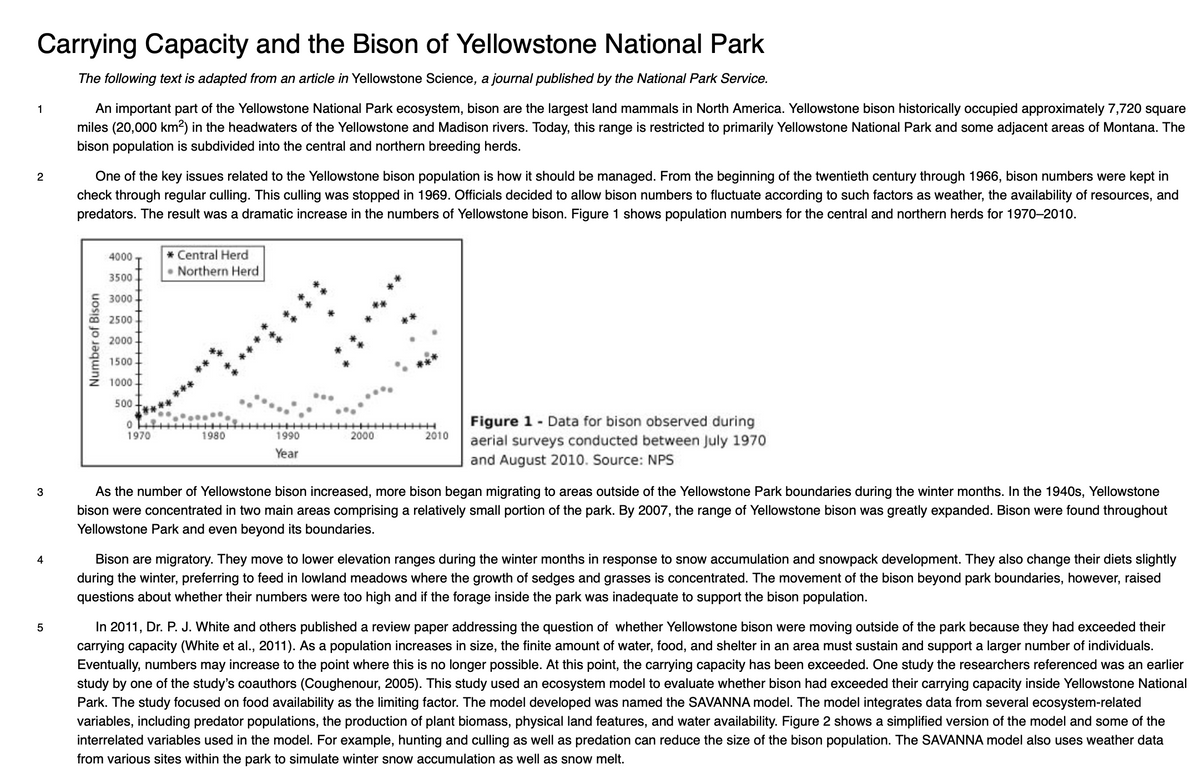
One of the key issues related to the Yellowstone bison population is how it should be managed. From the beginning of the twentieth century through 1966, bison numbers were kept in
check through regular culling. This culling was stopped in 1969. Officials decided to allow bison numbers to fluctuate according to such factors as weather, the availability of resources, and
predators. The result was a dramatic increase in the numbers of Yellowstone bison. Figure 1 shows population numbers for the central and northern herds for 1970-2010.
Number of Bison
4000
3500
3000
2500
2000
1500
1000
500
0
1970
* Central Herd
Northern Herd
1980
1990
Year
2000
2010
Figure 1 - Data for bison observed during
aerial surveys conducted between July 1970
and August 2010. Source: NPS
As the number of Yellowstone bison increased, more bison began migrating to areas outside of the Yellowstone Park boundaries during the winter months. In the 1940s, Yellowstone
bison were concentrated in two main areas comprising a relatively small portion of the park. By 2007, the range of Yellowstone bison was greatly expanded. Bison were found throughout
Yellowstone Park and even beyond its boundaries.
Bison are migratory. They move to lower elevation ranges during the winter months in response to snow accumulation and snowpack development. They also change their diets slightly
during the winter, preferring to feed in lowland meadows where the growth of sedges and grasses is concentrated. The movement of the bison beyond park boundaries, however, raised
questions about whether their numbers were too high and if the forage inside the park was inadequate to support the bison population.
In 2011, Dr. P. J. White and others published a review paper addressing the question of whether Yellowstone bison were moving outside of the park because they had exceeded their
carrying capacity (White et al., 2011). As a population increases in size, the finite amount of water, food, and shelter in an area must sustain and support a larger number of individuals.
Eventually, numbers may increase to the point where this is no longer possible. At this point, the carrying capacity has been exceeded. One study the researchers referenced was an earlier
study by one of the study's coauthors (Coughenour, 2005). This study used an ecosystem model to evaluate whether bison had exceeded their carrying capacity inside Yellowstone National
Park. The study focused on food availability as the limiting factor. The model developed was named the SAVANNA model. The model integrates data from several ecosystem-related
variables, including predator populations, the production of plant biomass, physical land features, and water availability. Figure 2 shows a simplified version of the model and some of the
interrelated variables used in the model. For example, hunting and culling as well as predation can reduce the size of the bison population. The SAVANNA model also uses weather data
from various sites within the park to simulate winter snow accumulation as well as snow melt.
Expert Solution
This question has been solved!
Explore an expertly crafted, step-by-step solution for a thorough understanding of key concepts.

This is a popular solution!

Trending now
This is a popular solution!

Step by step
Solved in 3 steps

Knowledge Booster


Learn more about
Need a deep-dive on the concept behind this application? Look no further. Learn more about this topic, biology and related others by exploring similar questions and additional content below.Recommended textbooks for you
Biology Today and Tomorrow without Physiology (Mi…
Biology
ISBN:
9781305117396
Author:
Cecie Starr, Christine Evers, Lisa Starr
Publisher:
Cengage Learning

Biochemistry
Biochemistry
ISBN:
9781305577206
Author:
Reginald H. Garrett, Charles M. Grisham
Publisher:
Cengage Learning

Biology 2e
Biology
ISBN:
9781947172517
Author:
Matthew Douglas, Jung Choi, Mary Ann Clark
Publisher:
OpenStax
Biology Today and Tomorrow without Physiology (Mi…
Biology
ISBN:
9781305117396
Author:
Cecie Starr, Christine Evers, Lisa Starr
Publisher:
Cengage Learning
Biochemistry
Biochemistry
ISBN:
9781305577206
Author:
Reginald H. Garrett, Charles M. Grisham
Publisher:
Cengage Learning
Biology 2e
Biology
ISBN:
9781947172517
Author:
Matthew Douglas, Jung Choi, Mary Ann Clark
Publisher:
OpenStax