What steps should be taken (mention all of them) in order to successfully specify/estimate a regression equation? (please answer to this question, not to the one on the picture)
What steps should be taken (mention all of them) in order to successfully specify/estimate a regression equation? (please answer to this question, not to the one on the picture)

Algebra: Structure And Method, Book 1
(REV)00th Edition
ISBN:9780395977224
Author:Richard G. Brown, Mary P. Dolciani, Robert H. Sorgenfrey, William L. Cole
Publisher:Richard G. Brown, Mary P. Dolciani, Robert H. Sorgenfrey, William L. Cole
Chapter2: Working With Real Numbers
Section2.3: Rules For Addition
Problem 7P

Related questions
Question
What steps should be taken (mention all of them) in order to successfully specify/estimate a regression equation? (please answer to this question, not to the one on the picture)
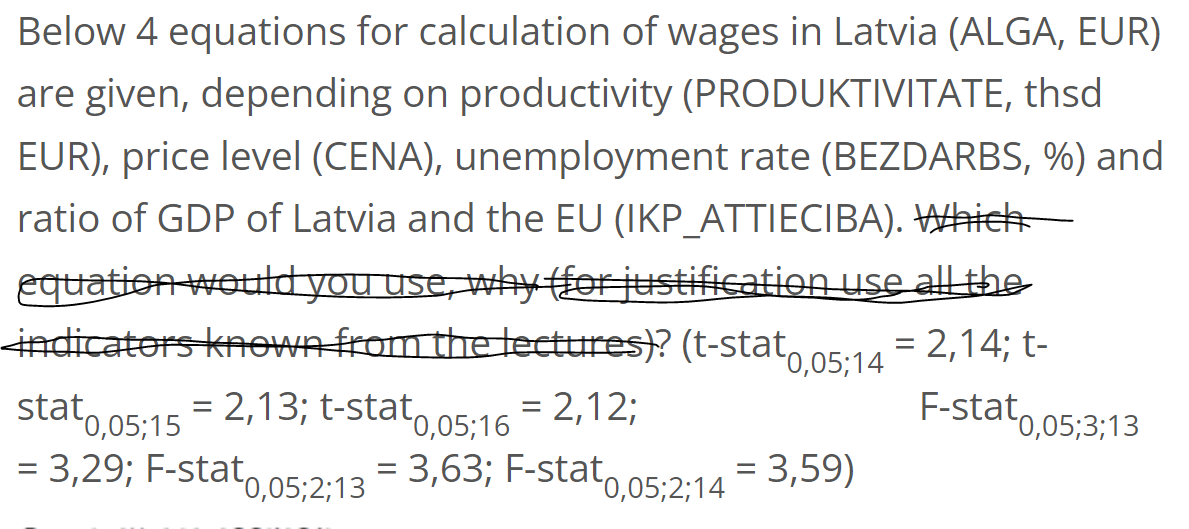
Transcribed Image Text:Below 4 equations for calculation of wages in Latvia (ALGA, EUR)
are given, depending on productivity (PRODUKTIVITATE, thsd
EUR), price level (CENA), unemployment rate (BEZDARBS, %) and
ratio of GDP of Latvia and the EU (IKP_ATTIECIBA). Which
equation would you use, why (for justification use all the
indicators known from the lectures)? (t-stat = 2,14; t-
F-stat 0,05;3;13
stat 0,05;15
= 2,13; t-stat0,05;16 = 2,12;
= 3,29; F-stat 0,05;2;13
= 3,63; F-stat 0,05;2;14 = 3,59)
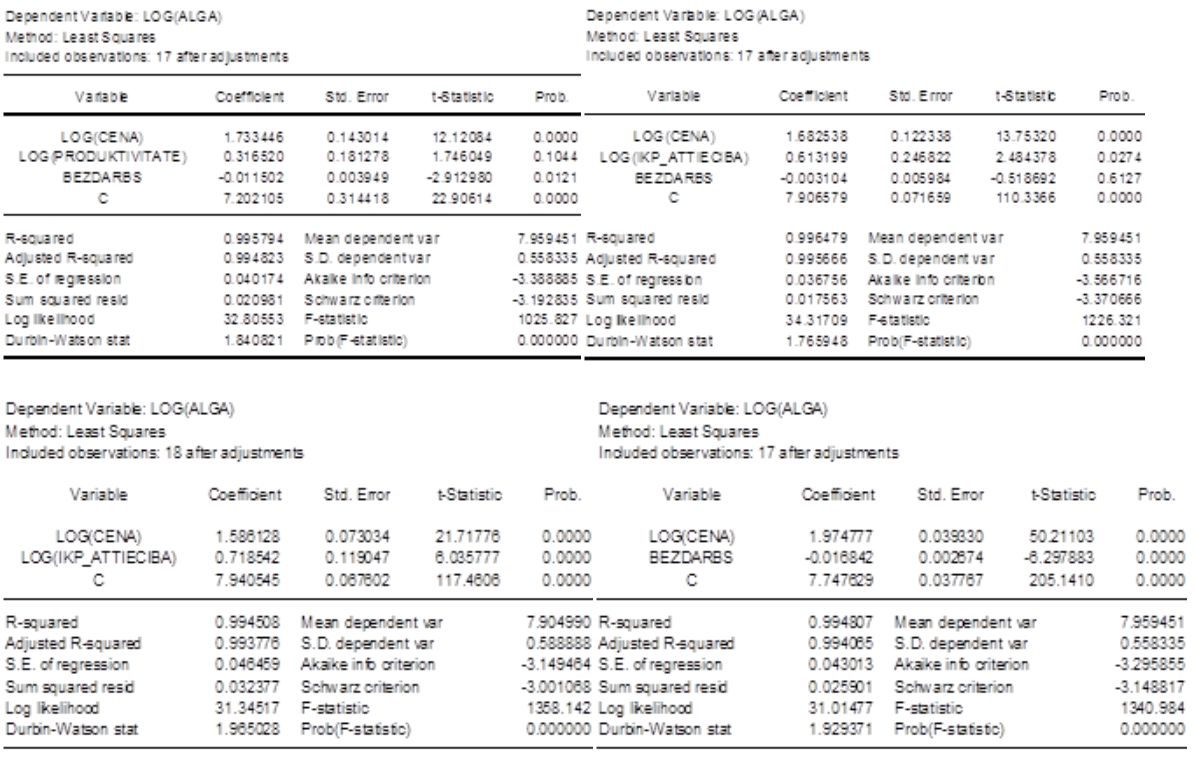
Transcribed Image Text:Dependent Vanable: LOG(ALGA)
Method: Least Squares
Included observations: 17 after adjustments
Vanable
LOG(CENA)
LOG PRODUKTIVITATE)
BEZDARBS
C
R-squared
Adjusted R-squared
S.E. of regression
Sum squared resid
Log Ikelihood
Durbin-Watson stat
Variable
LOG(CENA)
LOG(IKP_ATTIECIBA)
C
Dependent Variable: LOG(ALGA)
Method: Least Squares
Included observations: 18 after adjustments
R-squared
Adjusted R-squared
Coefficient
S.E. of regression
Sum squared resid
Log likelihood
Durbin-Watson stat
1.733446
0.316520
-0.011502
7.202105
Coefficient
Std. Error
1.588128
0.718542
7.940545
0.143014
0.181278
0.003949
0.314418
0.995794 Mean dependent var
0.994823 S.D. dependentvar
0.040174 Akake into criterion
0.020981 Schwarz ofterion
32.80553 F-statistic
1.840821 Prob (F-statistic)
Std. Emor
t-Statistic
0.073034
0.119047
0.087802
12.12084
1.746049
-2.912980
22.90614
+-Statistic
21.71778
6.035777
117.4806
0.994508 Mean dependent var
0.993778 S.D. dependent var
0.048459 Akaike info criterion
0.032377 Schwarz criterion
31.34517 F-statistic
1.985028 Prob(F-statistic)
Prob.
0.0121
0.0000
Dependent Varable: LOG (ALGA)
Method: Least Squares
Included observations: 17 after adjustments
0.0000
LOG (CENA)
0.1044 LOG (IKP_ATTIECIBA)
Prob.
Variable
7.959451 R-squared
0.558335 Adjusted R-squared
-3.388885 S.E. of regression
-3.192835 Sum squared resid
1025.827 Log Ikelihood
0.000000 Durbin-Watson stat
0.0000
0.0000
0.0000
BEZDARBS
C
Variable
LOG(CENA)
BEZDARBS
C
Coefficient
7.904990 R-squared
0.588888 Adjusted R-squared
-3.149484 S.E. of regression
-3.001068 Sum squared resid
1358.142 Log likelihood
0.000000 Durbin-Watson stat
1.682538
0.613199
-0.003104
7.906579
Dependent Variable: LOG(ALGA)
Method: Least Squares
Included observations: 17 after adjustments
Std. Error
Coefficient
0.122338
0.246822
1.974777
-0.016842
7.747829
0.005984
0.071659
Mean dependent var
0.996479
0.995666
S.D. dependent var
0.036756 Akalike into criteron
0.017563 Schwarz criterion
34.31709 F-statistic
1.765948 Prob(F-statistic)
Std. Emor
t-Statistic
0.039330
0.002674
0.037787
13.75320
2.484378
-0.518692
110.3366
t-Statistic
Mean dependent var
0.994807
0.994065 S.D. dependent var
0.043013 Akaike info criterion
0.025901 Schwarz criterion
31.01477 F-statistic
1.929371 Prob(F-statistic)
Prob
7.959451
0.558335
-3.566716
-3.370666
5021103
-8.297883
205.1410
0.0000
0.0274
0.6127
0.0000
1226.321
0.000000
Prob.
0.0000
0.0000
0.0000
7.959451
0.558335
-3.295855
-3.148817
1340.984
0.000000
Expert Solution
This question has been solved!
Explore an expertly crafted, step-by-step solution for a thorough understanding of key concepts.

Step by step
Solved in 3 steps

Recommended textbooks for you
Algebra: Structure And Method, Book 1
Algebra
ISBN:
9780395977224
Author:
Richard G. Brown, Mary P. Dolciani, Robert H. Sorgenfrey, William L. Cole
Publisher:
McDougal Littell

Glencoe Algebra 1, Student Edition, 9780079039897…
Algebra
ISBN:
9780079039897
Author:
Carter
Publisher:
McGraw Hill
Algebra: Structure And Method, Book 1
Algebra
ISBN:
9780395977224
Author:
Richard G. Brown, Mary P. Dolciani, Robert H. Sorgenfrey, William L. Cole
Publisher:
McDougal Littell
Glencoe Algebra 1, Student Edition, 9780079039897…
Algebra
ISBN:
9780079039897
Author:
Carter
Publisher:
McGraw Hill