What value of T makes these two cash flow diagrams (see figure) economically equivalent at 15% annual interest? (Show your complete solution) $1,000 $1,000 2T $500 $500 T 2 3 6. 1 2 ΕΟΥ ΕΟΥ 3T
What value of T makes these two cash flow diagrams (see figure) economically equivalent at 15% annual interest? (Show your complete solution) $1,000 $1,000 2T $500 $500 T 2 3 6. 1 2 ΕΟΥ ΕΟΥ 3T

Engineering Fundamentals: An Introduction to Engineering (MindTap Course List)
5th Edition
ISBN:9781305084766
Author:Saeed Moaveni
Publisher:Saeed Moaveni
Chapter20: Engineering Economics
Section: Chapter Questions
Problem 19P

Related questions
Question
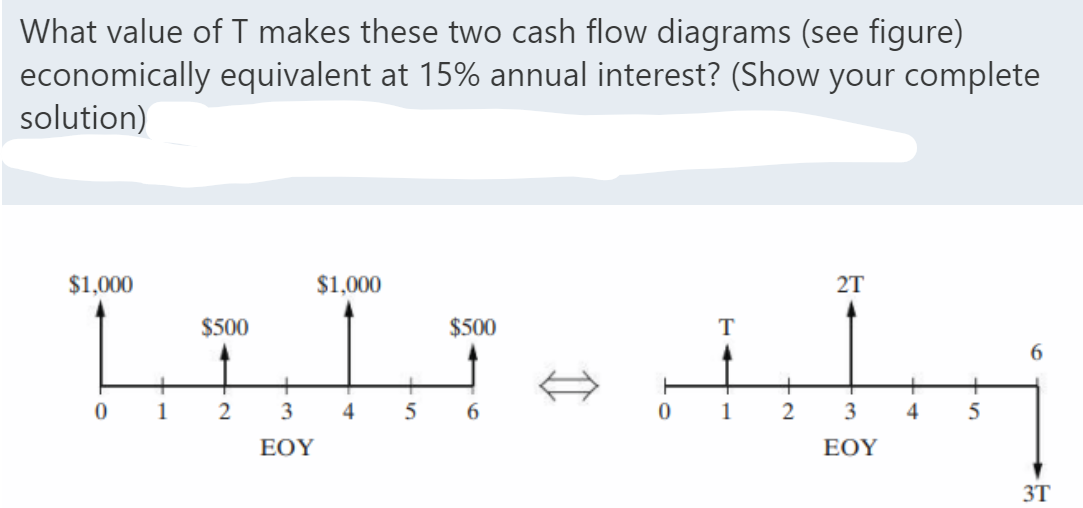
Transcribed Image Text:What value of I makes these two cash flow diagrams (see figure)
economically equivalent at 15% annual interest? (Show your complete
solution)
$1,000
$1,000
2T
$500
$500
T
6.
3
4
5
6.
1
2
3
4
EOY
ΕΟΥ
3T
Expert Solution
This question has been solved!
Explore an expertly crafted, step-by-step solution for a thorough understanding of key concepts.

Step by step
Solved in 3 steps with 1 images

Knowledge Booster


Learn more about
Need a deep-dive on the concept behind this application? Look no further. Learn more about this topic, civil-engineering and related others by exploring similar questions and additional content below.Recommended textbooks for you
Engineering Fundamentals: An Introduction to Engi…
Civil Engineering
ISBN:
9781305084766
Author:
Saeed Moaveni
Publisher:
Cengage Learning
Engineering Fundamentals: An Introduction to Engi…
Civil Engineering
ISBN:
9781305084766
Author:
Saeed Moaveni
Publisher:
Cengage Learning