Laila wants to create a data display to clearly show the median salary, the highest salary, and the lowest salary of the 685 employees at her company. She is trying to decide whether she should create a dot plot, a box plot, or a histogram of the salaries. A sample of the data is shown below. $25,745; $26,512; $27,322; $27,750; $29,820; $32,500; $35,448; $52,020; $63,485; $87,167
Laila wants to create a data display to clearly show the median salary, the highest salary, and the lowest salary of the 685 employees at her company. She is trying to decide whether she should create a dot plot, a box plot, or a histogram of the salaries. A sample of the data is shown below. $25,745; $26,512; $27,322; $27,750; $29,820; $32,500; $35,448; $52,020; $63,485; $87,167

Glencoe Algebra 1, Student Edition, 9780079039897, 0079039898, 2018
18th Edition
ISBN:9780079039897
Author:Carter
Publisher:Carter
Chapter10: Statistics
Section10.3: Measures Of Spread
Problem 8PPS

Related questions
Question
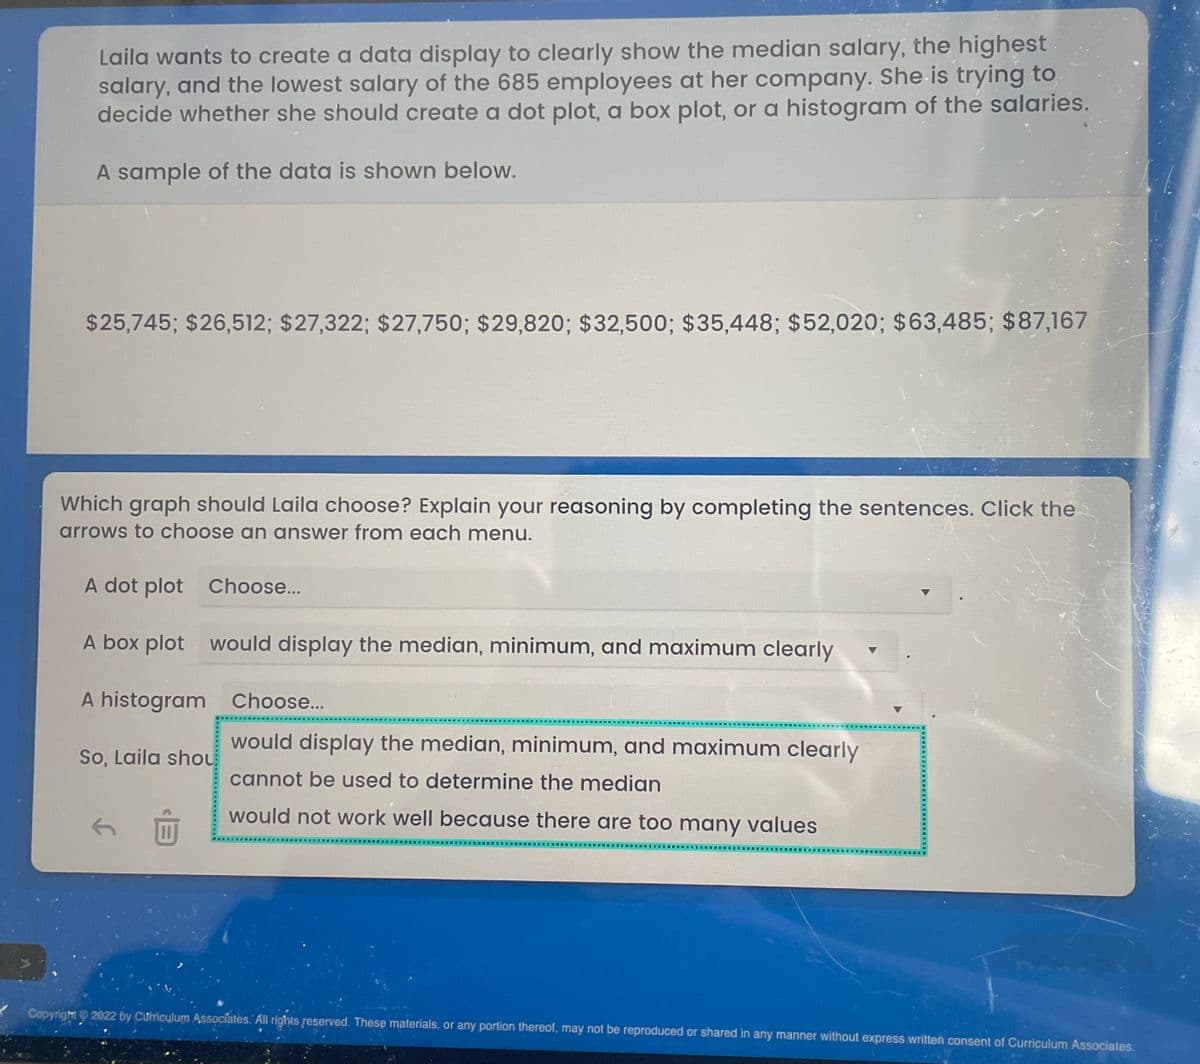
Transcribed Image Text:Laila wants to create a data display to clearly show the median salary, the highest
salary, and the lowest salary of the 685 employees at her company. She is trying to
decide whether she should create a dot plot, a box plot, or a histogram of the salaries.
A sample of the data is shown below.
$25,745; $26,512; $27,322; $27,750; $29,820; $32,500; $35,448; $52,020; $63,485; $87,167
Which graph should Laila choose? Explain your reasoning by completing the sentences. Click the
arrows to choose an answer from each menu.
A dot plot Choose...
A box plot
would display the median, minimum, and maximum clearly
A histogram
Choose...
So, Laila shou
would display the median, minimum, and maximum clearly
cannot be used to determine the median
would not work well because there are too many values
Copyright 2022 by Curriculum Associates. All rights reserved. These materials, or any portion thereof, may not be reproduced or shared in any manner without express written consent of Curriculum Associates.
Expert Solution
This question has been solved!
Explore an expertly crafted, step-by-step solution for a thorough understanding of key concepts.

This is a popular solution!

Trending now
This is a popular solution!

Step by step
Solved in 2 steps with 1 images

Follow-up Questions
Read through expert solutions to related follow-up questions below.
Follow-up Question
What would it be for the histogram box?

Transcribed Image Text:Laila wants to create a data display to clearly show the median salary, the highest
salary, and the lowest salary of the 685 employees at her company. She is trying to
decide whether she should create a dot plot, a box plot, or a histogram of the salaries.
A sample of the data is shown below.
$25,745; $26,512; $27,322; $27,750; $29,820; $32,500; $35,448; $52,020; $63,485; $87,167
Which graph should Laila choose? Explain your reasoning by completing the sentences. Click the
arrows to choose an answer from each menu.
A dot plot Choose...
A box plot
would display the median, minimum, and maximum clearly
A histogram
Choose...
So, Laila shou
would display the median, minimum, and maximum clearly
cannot be used to determine the median
would not work well because there are too many values
Copyright 2022 by Curriculum Associates. All rights reserved. These materials, or any portion thereof, may not be reproduced or shared in any manner without express written consent of Curriculum Associates.
Solution
Recommended textbooks for you
Glencoe Algebra 1, Student Edition, 9780079039897…
Algebra
ISBN:
9780079039897
Author:
Carter
Publisher:
McGraw Hill

Holt Mcdougal Larson Pre-algebra: Student Edition…
Algebra
ISBN:
9780547587776
Author:
HOLT MCDOUGAL
Publisher:
HOLT MCDOUGAL

Big Ideas Math A Bridge To Success Algebra 1: Stu…
Algebra
ISBN:
9781680331141
Author:
HOUGHTON MIFFLIN HARCOURT
Publisher:
Houghton Mifflin Harcourt
Glencoe Algebra 1, Student Edition, 9780079039897…
Algebra
ISBN:
9780079039897
Author:
Carter
Publisher:
McGraw Hill
Holt Mcdougal Larson Pre-algebra: Student Edition…
Algebra
ISBN:
9780547587776
Author:
HOLT MCDOUGAL
Publisher:
HOLT MCDOUGAL
Big Ideas Math A Bridge To Success Algebra 1: Stu…
Algebra
ISBN:
9781680331141
Author:
HOUGHTON MIFFLIN HARCOURT
Publisher:
Houghton Mifflin Harcourt

Functions and Change: A Modeling Approach to Coll…
Algebra
ISBN:
9781337111348
Author:
Bruce Crauder, Benny Evans, Alan Noell
Publisher:
Cengage Learning