When a bactericide was added to a nutrientbroth in which bacteria were growing, the bacterium populationcontinued to grow for a while, but then stopped growing andbegan to decline. The size of the population at time t (hours) wasb = 106 + 104t - 103t2. Find the growth rates at t = 0 hours.


Contingency Table
A contingency table can be defined as the visual representation of the relationship between two or more categorical variables that can be evaluated and registered. It is a categorical version of the scatterplot, which is used to investigate the linear relationship between two variables. A contingency table is indeed a type of frequency distribution table that displays two variables at the same time.
Binomial Distribution
Binomial is an algebraic expression of the sum or the difference of two terms. Before knowing about binomial distribution, we must know about the binomial theorem.
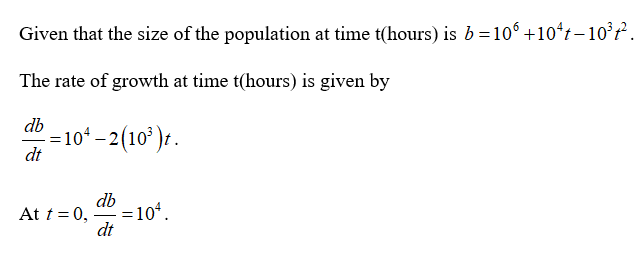
When a bactericide was added to a nutrient
broth in which bacteria were growing, the bacterium population
continued to grow for a while, but then stopped growing and
began to decline. The size of the population at time t (hours) was
b = 106 + 104t - 103t2. Find the growth rates at t = 0 hours.

Step by step
Solved in 2 steps with 2 images


