When creating visuals, you should focus on the data and not the audience. True False
When creating visuals, you should focus on the data and not the audience. True False

Principles of Information Systems (MindTap Course List)
13th Edition
ISBN:9781305971776
Author:Ralph Stair, George Reynolds
Publisher:Ralph Stair, George Reynolds
Chapter10: Knowledge Management And Specialized Information Systems
Section: Chapter Questions
Problem 8SAT

Related questions
Question
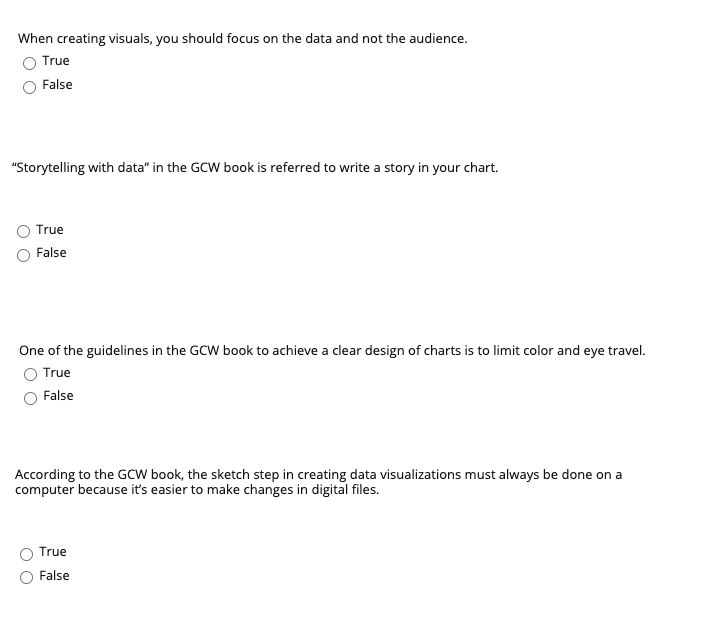
Transcribed Image Text:When creating visuals, you should focus on the data and not the audience.
True
False
"Storytelling with data" in the GCW book is referred to write a story in your chart.
True
False
One of the guidelines in the GCW book to achieve a clear design of charts is to limit color and eye travel.
True
False
According to the GCW book, the sketch step in creating data visualizations must always be done on a
computer because it's easier to make changes in digital files.
True
False

Transcribed Image Text:Increasing the persuasive power of your charts means using persuasive techniques to manipulate reality.
True
False
Expert Solution
This question has been solved!
Explore an expertly crafted, step-by-step solution for a thorough understanding of key concepts.

This is a popular solution!

Trending now
This is a popular solution!

Step by step
Solved in 2 steps

Knowledge Booster


Learn more about
Need a deep-dive on the concept behind this application? Look no further. Learn more about this topic, computer-science and related others by exploring similar questions and additional content below.Recommended textbooks for you
Principles of Information Systems (MindTap Course…
Computer Science
ISBN:
9781305971776
Author:
Ralph Stair, George Reynolds
Publisher:
Cengage Learning
Principles of Information Systems (MindTap Course…
Computer Science
ISBN:
9781305971776
Author:
Ralph Stair, George Reynolds
Publisher:
Cengage Learning