Activity -App at can plot the graph of

C++ for Engineers and Scientists
4th Edition
ISBN:9781133187844
Author:Bronson, Gary J.
Publisher:Bronson, Gary J.
Chapter2: Problem Solving Using C++using
Section2.1: Introduction To C++
Problem 12E: (Practice) You’re given the job of planting a vegetable garden. Determine a set of subtasks to...

Related questions
Question
Hello! I really need help with this assignment :) thank you!
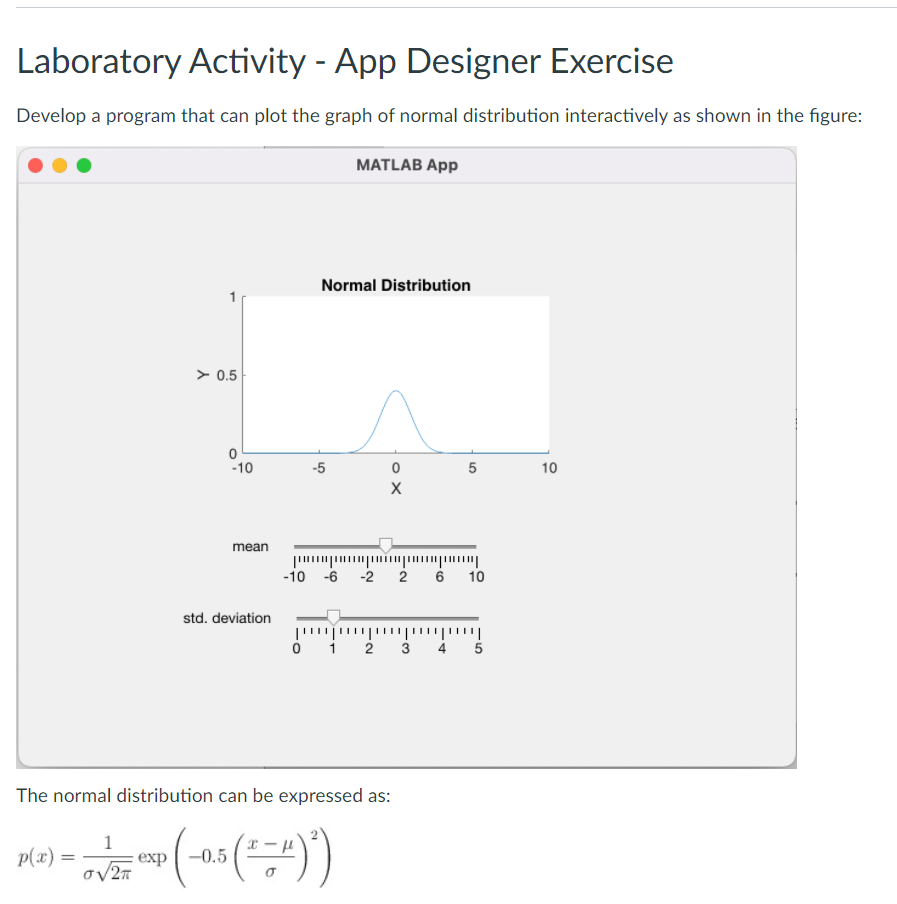
Transcribed Image Text:Laboratory Activity - App Designer Exercise
Develop a program that can plot the graph of normal distribution interactively as shown in the figure:
MATLAB App
Normal Distribution
> 0.5
-10
-5
10
mean
-10 -6 -2 2 6 10
std. deviation
o i 2 3 4 5
The normal distribution can be expressed as:
p(x) =
1
exp
-0.5
LO
o X
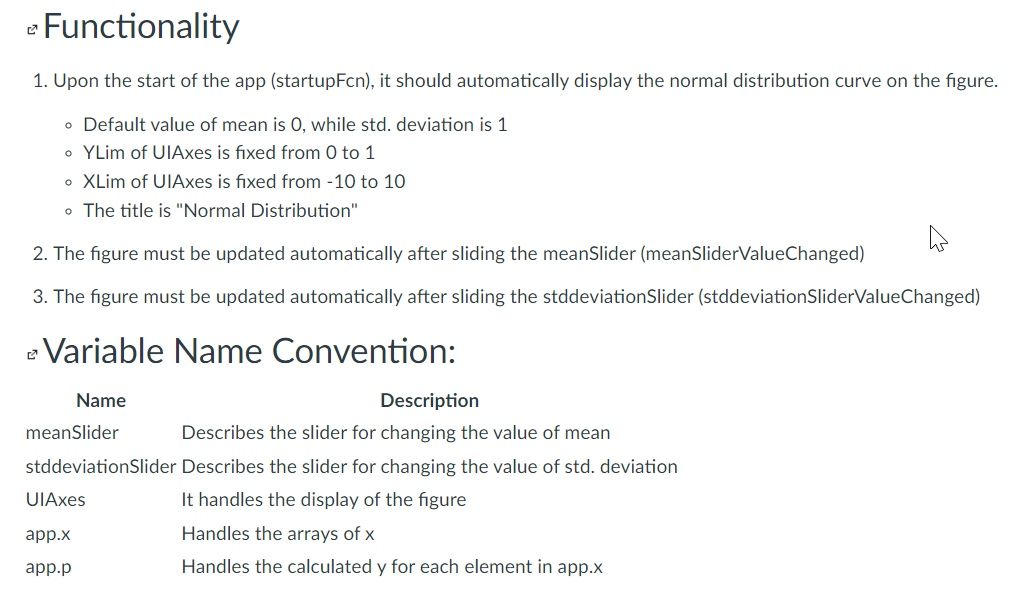
Transcribed Image Text:e Functionality
1. Upon the start of the app (startupFcn), it should automatically display the normal distribution curve on the figure.
• Default value of mean is 0, while std. deviation is 1
• YLim of UIAxes is fixed from 0 to 1
• XLim of UIAxes is fixed from -10 to 10
• The title is "Normal Distribution"
2. The figure must be updated automatically after sliding the meanSlider (meanSliderValueChanged)
3. The figure must be updated automatically after sliding the stddeviationSlider (stddeviationSliderValueChanged)
e Variable Name Convention:
Name
Description
meanSlider
Describes the slider for changing the value of mean
stddeviationSlider Describes the slider for changing the value of std. deviation
UIAxes
It handles the display of the figure
аpp.x
Handles the arrays of x
app.p
Handles the calculated y for each element in app.x
Expert Solution
This question has been solved!
Explore an expertly crafted, step-by-step solution for a thorough understanding of key concepts.

Step by step
Solved in 2 steps

Knowledge Booster


Learn more about
Need a deep-dive on the concept behind this application? Look no further. Learn more about this topic, computer-science and related others by exploring similar questions and additional content below.Recommended textbooks for you
C++ for Engineers and Scientists
Computer Science
ISBN:
9781133187844
Author:
Bronson, Gary J.
Publisher:
Course Technology Ptr

Operations Research : Applications and Algorithms
Computer Science
ISBN:
9780534380588
Author:
Wayne L. Winston
Publisher:
Brooks Cole
C++ for Engineers and Scientists
Computer Science
ISBN:
9781133187844
Author:
Bronson, Gary J.
Publisher:
Course Technology Ptr
Operations Research : Applications and Algorithms
Computer Science
ISBN:
9780534380588
Author:
Wayne L. Winston
Publisher:
Brooks Cole