When is the function represented by the graph increasing? That is, when is the motorcycle’s speed increasing? Select all that apply. Answer choices: 1) Between 0 minutes and 2 minutes 2) Between 2 minutes and 4 minutes 3) Between 4 minutes and 5 minutes 4) Between 5 minutes and 6 minutes Question 2 b. When is the function represented by the graph decreasing? That is, when is the motorcycle’s speed decreasing? Select all that apply. Answer choices: 1) Between 0 minutes and 2 minutes 2) Between 2 minutes and 4 minutes 3) Between 4 minutes and 5 minutes
When is the function represented by the graph increasing? That is, when is the motorcycle’s speed increasing? Select all that apply. Answer choices: 1) Between 0 minutes and 2 minutes 2) Between 2 minutes and 4 minutes 3) Between 4 minutes and 5 minutes 4) Between 5 minutes and 6 minutes Question 2 b. When is the function represented by the graph decreasing? That is, when is the motorcycle’s speed decreasing? Select all that apply. Answer choices: 1) Between 0 minutes and 2 minutes 2) Between 2 minutes and 4 minutes 3) Between 4 minutes and 5 minutes

Glencoe Algebra 1, Student Edition, 9780079039897, 0079039898, 2018
18th Edition
ISBN:9780079039897
Author:Carter
Publisher:Carter
Chapter3: Linear And Nonlinear Functions
Section: Chapter Questions
Problem 46SGR

Related questions
Topic Video
Question
100%
a. When is the function represented by the graph increasing? That is, when is the motorcycle’s speed increasing? Select all that apply.
Answer choices:
1) Between 0 minutes and 2 minutes
2) Between 2 minutes and 4 minutes
3) Between 4 minutes and 5 minutes
4) Between 5 minutes and 6 minutes
Question 2
b. When is the function represented by the graph decreasing? That is, when is the motorcycle’s speed decreasing? Select all that apply.
Answer choices:
1) Between 0 minutes and 2 minutes
2) Between 2 minutes and 4 minutes
3) Between 4 minutes and 5 minutes
4) Between 5 minutes and 6 minutes
Question 3
c. When is the function represented by the graph constant? That is, when is the motorcycle’s speed constant. Select all that apply.
Answer choices:
1) Between 0 minutes and 2 minutes
2) Between 2 minutes and 4 minutes
3) Between 4 minutes and 5 minutes
4) Between 5 minutes and 6 minutes
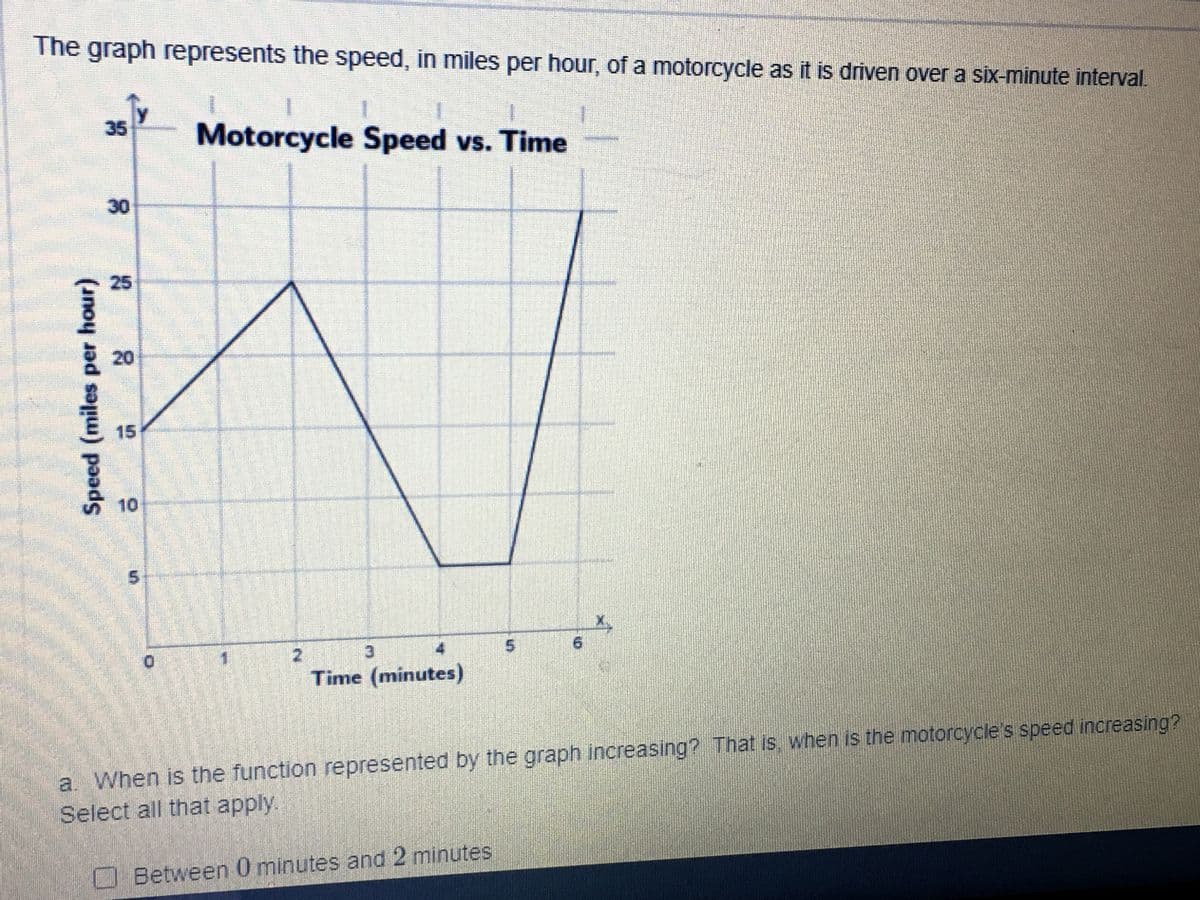
Transcribed Image Text:The graph represents the speed, in miles per hour, of a motorcycle as it is driven over a six-minute interval.
35
Motorcycle Speed vs. Time
30
25
20
15
10
1.
2.
3.
4
Time (minutes)
a. When is the function represented by the graph increasing? That is when is the motorcycle's speed increasing?
Select all that apply.
O Between 0 minutes and 2 minutes
6.
5.
Speed (miles per hour)
Expert Solution
This question has been solved!
Explore an expertly crafted, step-by-step solution for a thorough understanding of key concepts.

This is a popular solution!

Trending now
This is a popular solution!

Step by step
Solved in 2 steps with 1 images

Knowledge Booster


Learn more about
Need a deep-dive on the concept behind this application? Look no further. Learn more about this topic, algebra and related others by exploring similar questions and additional content below.Recommended textbooks for you
Glencoe Algebra 1, Student Edition, 9780079039897…
Algebra
ISBN:
9780079039897
Author:
Carter
Publisher:
McGraw Hill


Trigonometry (MindTap Course List)
Trigonometry
ISBN:
9781337278461
Author:
Ron Larson
Publisher:
Cengage Learning
Glencoe Algebra 1, Student Edition, 9780079039897…
Algebra
ISBN:
9780079039897
Author:
Carter
Publisher:
McGraw Hill
Trigonometry (MindTap Course List)
Trigonometry
ISBN:
9781337278461
Author:
Ron Larson
Publisher:
Cengage Learning

Trigonometry (MindTap Course List)
Trigonometry
ISBN:
9781305652224
Author:
Charles P. McKeague, Mark D. Turner
Publisher:
Cengage Learning

College Algebra (MindTap Course List)
Algebra
ISBN:
9781305652231
Author:
R. David Gustafson, Jeff Hughes
Publisher:
Cengage Learning

Big Ideas Math A Bridge To Success Algebra 1: Stu…
Algebra
ISBN:
9781680331141
Author:
HOUGHTON MIFFLIN HARCOURT
Publisher:
Houghton Mifflin Harcourt