When subjects were treated with a drug, their systolic blood pressure readings (in mm Hg) were measured before and after the drug was taken. Results are given in the table below. Assume that the paired sample data is a simple random sample and that the differences have a distribution that is approximately normal. Using a 0.01 significance level, is there sufficient evidence to support the claim that the drug is effective in lowering systolic blood pressure? Before After OA. Ho: Hg = 0 H₁: Hd>0 159 191 OC. Ho Hd=0 H₁: P <0 Identify the test statistic t=(Round to two decimal places as needed.) Identify the P-value. P-value Since the P-value is 158 159 (Round to three decimal places as needed.) than the significance level, 167 177 Ho. There is 169 186 205 154 195 176 In this example, is the mean value of the differences d for the population of all pairs of data, where each individual difference d is defined as the systolic blood pressure reading before the drug was taken minus the reading after the drug was taken. What are the null and alternative hypotheses for the hypothesis test? OB. Ho: P0 H₁: Pg > 0 210 179 OD. Ho: #0 H₁: Pg=0 189 155 205 143 evidence to support the claim that the drug is effective in lowering systolic blood pressure. 188 179 175 162 157 152
When subjects were treated with a drug, their systolic blood pressure readings (in mm Hg) were measured before and after the drug was taken. Results are given in the table below. Assume that the paired sample data is a simple random sample and that the differences have a distribution that is approximately normal. Using a 0.01 significance level, is there sufficient evidence to support the claim that the drug is effective in lowering systolic blood pressure? Before After OA. Ho: Hg = 0 H₁: Hd>0 159 191 OC. Ho Hd=0 H₁: P <0 Identify the test statistic t=(Round to two decimal places as needed.) Identify the P-value. P-value Since the P-value is 158 159 (Round to three decimal places as needed.) than the significance level, 167 177 Ho. There is 169 186 205 154 195 176 In this example, is the mean value of the differences d for the population of all pairs of data, where each individual difference d is defined as the systolic blood pressure reading before the drug was taken minus the reading after the drug was taken. What are the null and alternative hypotheses for the hypothesis test? OB. Ho: P0 H₁: Pg > 0 210 179 OD. Ho: #0 H₁: Pg=0 189 155 205 143 evidence to support the claim that the drug is effective in lowering systolic blood pressure. 188 179 175 162 157 152

Glencoe Algebra 1, Student Edition, 9780079039897, 0079039898, 2018
18th Edition
ISBN:9780079039897
Author:Carter
Publisher:Carter
Chapter10: Statistics
Section10.4: Distributions Of Data
Problem 19PFA

Related questions
Question
Transcribed Image Text:K
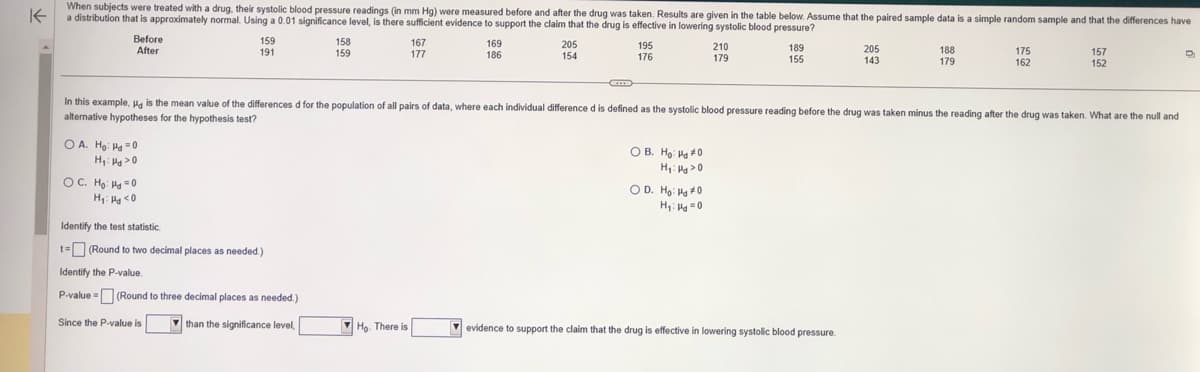
When subjects were treated with a drug, their systolic blood pressure readings (in mm Hg) were measured before and after the drug was taken. Results are given in the table below. Assume that the paired sample data is a simple random sample and that the differences have
a distribution that is approximately normal. Using a 0.01 significance level, is there sufficient evidence to support the claim that the drug is effective in lowering systolic blood pressure?
Before
After
OA. Ho: Hd=0
H₁: Hd>0
159
191
OC. Ho: Hd=0
H₁: Hg <0
158
159
Identify the test statistic
t=(Round to two decimal places as needed.)
Identify the P-value.
P-value = (Round to three decimal places as needed.)
Since the P-value is
than the significance level,
167
177
Ho. There is
169
186
205
154
195
176
OB. Ho: H0
H₁: Hg >0
210
179
In this example, H is the mean value of the differences d for the population of all pairs of data, where each individual difference d is defined as the systolic blood pressure reading before the drug was taken minus the reading after the drug was taken. What are the null and
alternative hypotheses for the hypothesis test?
OD. Ho: H0
H₁: Hd=0
189
155
205
143
evidence to support the claim that the drug is effective in lowering systolic blood pressure.
188
179
175
162
157
152
D
Expert Solution
This question has been solved!
Explore an expertly crafted, step-by-step solution for a thorough understanding of key concepts.

This is a popular solution!

Trending now
This is a popular solution!

Step by step
Solved in 5 steps with 1 images

Recommended textbooks for you
Glencoe Algebra 1, Student Edition, 9780079039897…
Algebra
ISBN:
9780079039897
Author:
Carter
Publisher:
McGraw Hill
Glencoe Algebra 1, Student Edition, 9780079039897…
Algebra
ISBN:
9780079039897
Author:
Carter
Publisher:
McGraw Hill