
MATLAB: An Introduction with Applications
6th Edition
ISBN: 9781119256830
Author: Amos Gilat
Publisher: John Wiley & Sons Inc
expand_more
expand_more
format_list_bulleted
Concept explainers
Question

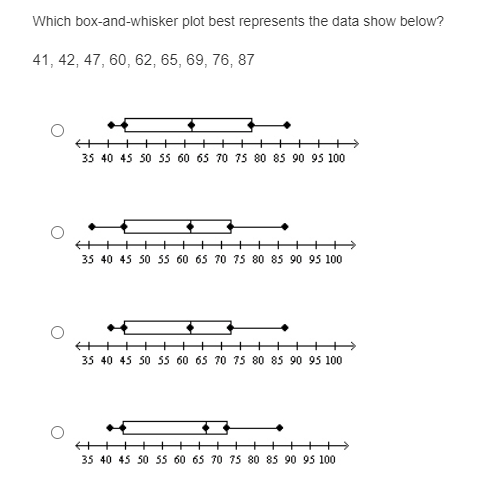
Transcribed Image Text:Which box-and-whisker plot best represents the data show below?
41, 42, 47, 60, 62, 65, 69, 76, 87
+++>
35 40 45 50 55 60 65 70 75 80 85 90 95 100
++++
35 40 45 50 55 60 65 70 75 80 85 90 95 100
35 40 45 50 ss 60 65 70 75 80 85 90 95 100
+++
++++
35 40 45 50 55 60 65 70 75 80 85 90 95 100
Expert Solution

This question has been solved!
Explore an expertly crafted, step-by-step solution for a thorough understanding of key concepts.
This is a popular solution
Trending nowThis is a popular solution!
Step by stepSolved in 2 steps with 3 images

Knowledge Booster
Learn more about
Need a deep-dive on the concept behind this application? Look no further. Learn more about this topic, statistics and related others by exploring similar questions and additional content below.Similar questions
- 41, 42, 47, 60, 62, 65, 69, 76, 87 Need Asap Pls.arrow_forwardThe following are the ages of 18 music teachers in a school district 29, 33, 36, 37, 38, 39, 40, 41, 42, 44, 44, 49, 49, 51, 53, 53, 54, 57 *Notice the ages are ordered from least to greatest Make a box-and-whisker plot for the data ++++++++++ID 25 30 35 40 45 50 55 60 Age pidolw buta o ml yna bnege f'nesob orwarrow_forwardThe following data are the ages (in years) of 17 economics teachers in a school district. 51, 46, 47, 48, 36, 27, 55, 34, 58, 50, 23, 51, 35, 37, 38, 49, 56 Send data to calculator Using the tool provided, construct a box-and-whisker plot for the data. ? H+HHH +++++++ +H +++++++D 20 25 30 35 40 45 50 55 60 Age of economics teacher (in years)arrow_forward
- Here is a set of data. 66 105 119 230 240 365 456 507 620 704 742 871 944 964 Identify the 5 number summary (min, Q1, median, Q3, max)arrow_forwardA pediatrician wants to determine the relation that may exist between a child's height and head circumference. She randomly selects 8 children from her practice, measures their height and head circumference and obtains the data shown below. Height Head Circumference 27 17.5 25 17 26.5 17.2 25.5 17 27.75 17.4 26.25 17.4 26 17.1 27.25 17.4 data table 3 0.997 4 0.950 5 0.878 6 0.811 7 0.754 8 0.707 9 0.666 10 0.632 11 0.602 12 0.576 13 0.553 14 0.532 15 0.514 16 0.497 17 0.482 18 0.468 19 0.456 20 0.444 21 0.433 22 0.423 23 0.413 24 0.404 25 0.396 26 0.388 27 0.381 28 0.374…arrow_forwardThe following are the ages of 16 music teachers in a school district. 26, 27, 28, 30, 34, 34, 38, 39, 40, 46, 46, 49, 49, 52, 53, 55. Notice that the ages are ordered from least to greatest. Make a box-and-whisker plot for the data. s ? TI 25 30 35 40 45 50 55 Agearrow_forward
- Fifteen students are asked to pick a number between 1 and 22. The numbers were recorded and organized into the following stemplot. Stem Leaf 0 2 3 3 5 6 7 7 8 1 0 1 1 2 3 5 2 1 Using the stemplot, create a box plot of the data. Be sure to label the five features.arrow_forwardThe following chart provides data that is widespread. Use this data to answer questions 11 through 14. Ages: 25 41 33 42 28 31 35 41 22 0. 27 23 34 40 38 38 28 25arrow_forwardIf the data below were represented with a stem-and-leaf plot, a stem of 2 would have how many leaves? 17, 22, 53, 74, 42, 62, 93, 12, 67, 29, 50 O A. 5 О в. 2 O C. 4 D. 3arrow_forward
- Below are numbers of hours that a sample of 19 college graduates reported working last week. 50, 58, 57, 52, 41, 38, 46, 53, 58, 68, 48, 52, 57, 65, 44, 62, 47, 42, 63 Send data to calculator Send data to Excel Using the tool provided, construct a box-and-whisker plot (sometimes called a boxplot) for the data. ? +++++D 50 55 60 65 70 35 40 45 Number of hours workedarrow_forwardFor the data set 8 14 6 10 9 the median isarrow_forwardPlease help 11 and 12arrow_forward
arrow_back_ios
SEE MORE QUESTIONS
arrow_forward_ios
Recommended textbooks for you
- MATLAB: An Introduction with ApplicationsStatisticsISBN:9781119256830Author:Amos GilatPublisher:John Wiley & Sons IncProbability and Statistics for Engineering and th...StatisticsISBN:9781305251809Author:Jay L. DevorePublisher:Cengage LearningStatistics for The Behavioral Sciences (MindTap C...StatisticsISBN:9781305504912Author:Frederick J Gravetter, Larry B. WallnauPublisher:Cengage Learning
- Elementary Statistics: Picturing the World (7th E...StatisticsISBN:9780134683416Author:Ron Larson, Betsy FarberPublisher:PEARSONThe Basic Practice of StatisticsStatisticsISBN:9781319042578Author:David S. Moore, William I. Notz, Michael A. FlignerPublisher:W. H. FreemanIntroduction to the Practice of StatisticsStatisticsISBN:9781319013387Author:David S. Moore, George P. McCabe, Bruce A. CraigPublisher:W. H. Freeman

MATLAB: An Introduction with Applications
Statistics
ISBN:9781119256830
Author:Amos Gilat
Publisher:John Wiley & Sons Inc

Probability and Statistics for Engineering and th...
Statistics
ISBN:9781305251809
Author:Jay L. Devore
Publisher:Cengage Learning

Statistics for The Behavioral Sciences (MindTap C...
Statistics
ISBN:9781305504912
Author:Frederick J Gravetter, Larry B. Wallnau
Publisher:Cengage Learning

Elementary Statistics: Picturing the World (7th E...
Statistics
ISBN:9780134683416
Author:Ron Larson, Betsy Farber
Publisher:PEARSON

The Basic Practice of Statistics
Statistics
ISBN:9781319042578
Author:David S. Moore, William I. Notz, Michael A. Fligner
Publisher:W. H. Freeman

Introduction to the Practice of Statistics
Statistics
ISBN:9781319013387
Author:David S. Moore, George P. McCabe, Bruce A. Craig
Publisher:W. H. Freeman