Which equation represents the graph shown below? 350 300 250 200 150 100 50 -40 40 80 120 160 200 240 280 320 360 -50 -100 -150 -200 -250 -300 -350 -400 Oy = 100 sin 160 O y = 100 cos (Eo) 160 O y = –100 cos (150¤) 160 O y = -100 sin (na) 160
Which equation represents the graph shown below? 350 300 250 200 150 100 50 -40 40 80 120 160 200 240 280 320 360 -50 -100 -150 -200 -250 -300 -350 -400 Oy = 100 sin 160 O y = 100 cos (Eo) 160 O y = –100 cos (150¤) 160 O y = -100 sin (na) 160

Algebra & Trigonometry with Analytic Geometry
13th Edition
ISBN:9781133382119
Author:Swokowski
Publisher:Swokowski
Chapter7: Analytic Trigonometry
Section7.3: The Addition And Subtraction Formulas
Problem 64E

Related questions
Question
I need help with this question
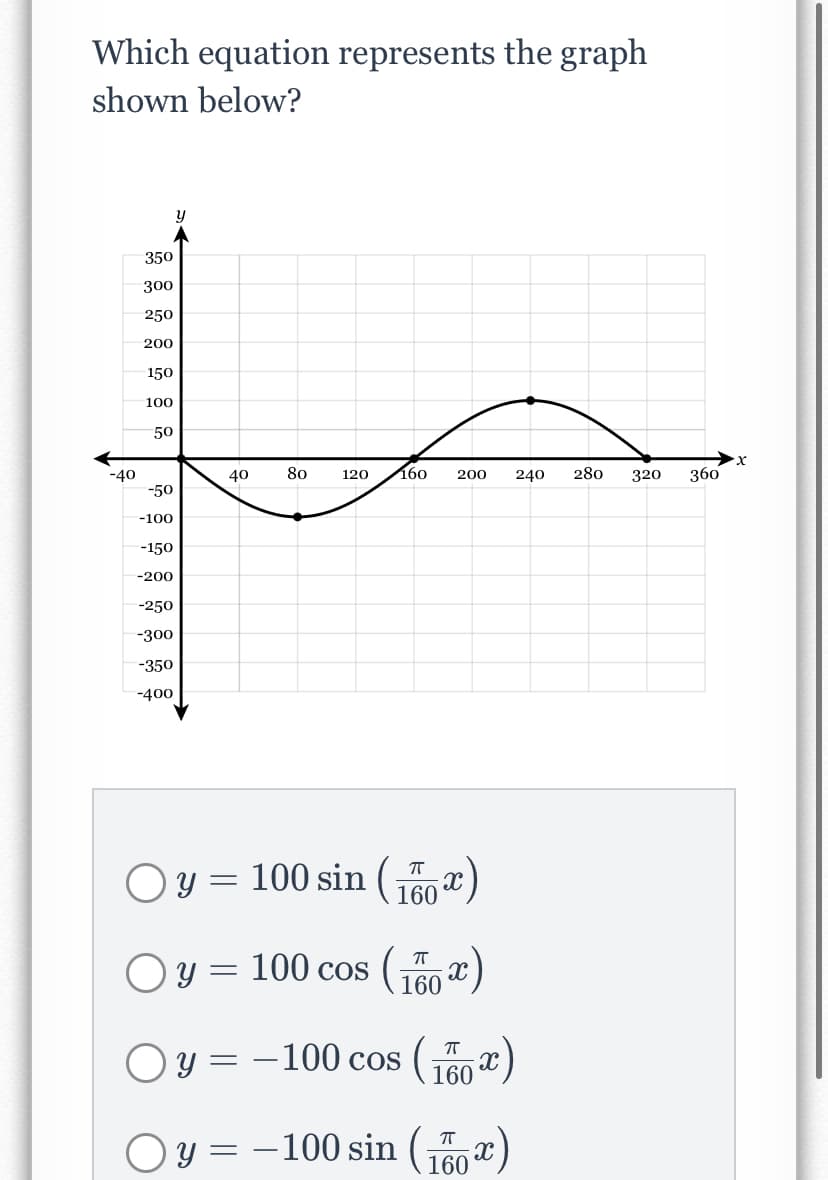
Transcribed Image Text:Which equation represents the graph
shown below?
350
300
250
200
150
100
50
-40
40
80
120
160
200
240
280
320
360
-50
-100
-150
-200
-250
-300
-350
-400
y = 100 sin ( j50 )
160
Oy = 100 cos (x)
160
y = -100 cos ()
160
y = –100 sin (160°
Expert Solution
This question has been solved!
Explore an expertly crafted, step-by-step solution for a thorough understanding of key concepts.

This is a popular solution!

Trending now
This is a popular solution!

Step by step
Solved in 2 steps

Recommended textbooks for you
Algebra & Trigonometry with Analytic Geometry
Algebra
ISBN:
9781133382119
Author:
Swokowski
Publisher:
Cengage
Algebra & Trigonometry with Analytic Geometry
Algebra
ISBN:
9781133382119
Author:
Swokowski
Publisher:
Cengage