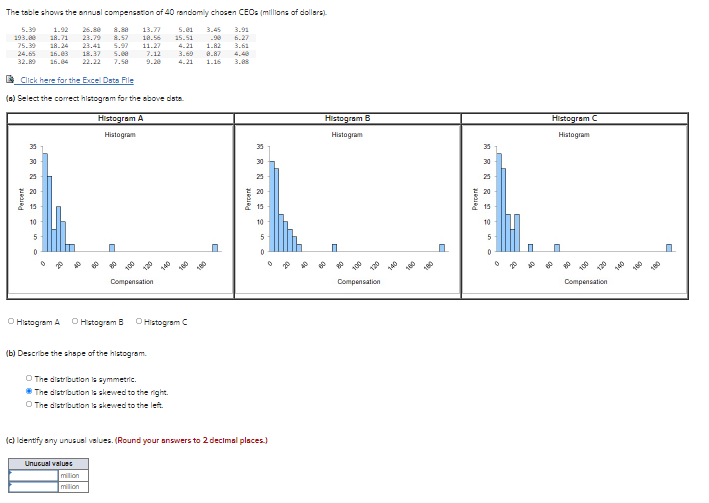
Which histogram is correct given the following data points above? What are the unusal values rounded to 2 decimal places?


Q: A researcher has collected the following sample data Calculate coffined of variation, which is the…
A: From the provided information, Type of work Mean (µ) Standard deviation (σ) 1 100 20…
Q: What is the scale of measurement that is most appropriate for each of the following variables? •…
A: For any measurement , data can be classified as being on one of four scales: nominal, ordinal,…
Q: The range of the sample data is (Round to one decimal place as needed.)
A: The maximum value of the data set is 10 and the minimum value is 1.
Q: 5. Which of the following is the most appropriate measure of central tendency for nominal data? (A)…
A: The mode is the measure which gives the most frequent value and nominal data is the type of data…
Q: $850 $900 $1400 $1200 $1050 $1000 $750 $1250 $1050 $565 Find the Q3 (third quartile) for this data…
A: Given that Data values : $850 , $900 , $1400 , $1200 , $1050 , $1000 , $750 , $1250 , $1050 , $565…
Q: Which of the following is the correct term for the calculation of the running average of five…
A: Running average is an average based on trials. Since it is information that we get from a number of…
Q: Please explain and interpret each of the following descriptive statistics for the variable shown in…
A: Following is the descriptive statistics of the data on child weight.
Q: Approximate the mean for following GFDT. Data Frequency 30 - 34 12 35 - 39 22 40 - 44 11 45 - 49 7…
A: Given Data: Data Midpoint (x) Frequency (f) xf 30-34 32 12 384 35-39 37 22 814 40-44 42 11…
Q: Select the correct answer for following. Which type of the analysis surmises the input range in…
A:
Q: Which of the following pairs of variables (attributes listed in parentheses) could be analyzed using…
A: The pairs of variables should be categorical (nominal/ordinal) in nature for the analysis of…
Q: As shown in the Crime Watch article of the local newspaper, 37% of the crimes in the county in the…
A: Given: As shown in the Crime Watch article of the local newspaper, 37% of the crimes in the county…
Q: 6. Which of the following statistics may be obtained even if not all the values in the data are…
A: Given problem Given that Which of the following statistics may be obtained even if not all the…
Q: Specify the mathematical symbol used for each of the following descriptive measures. a. Sample mean…
A:
Q: Consider the following dataset: 10 22 63 70 98 Find the percentile rank of '10'.…
A: Given: The data is as follows 10, 22, 63, 70, 98
Q: alculate the SEM for the following data: a. Population standard deviation = 25 b. Sample size = 36
A:
Q: Create a histogram using SPSS and the following data:
A:
Q: Which of the following does NOT reveal the variation (spread) of the data? Check all that apply.…
A: A measure of central tendency helps to identify the location of a dataset, whereas a measure of…
Q: For the dot plot shown, which of the statistical values listed would be least affected by the…
A: Solution Given distribution shows the dot plot of a distribution and the distribution is right…
Q: Which of the following is NOT one of IBM's big data characteristics? Variety Velocity Venn diagram…
A: Big data is the data set, which have huge volume that is beyond to perform manual analysis. Such…
Q: Which of the following is not a measure of position? a First Quartile b. Median C. Mean D, Fourth…
A:
Q: Using a spectrophotometric analytical technique, the glucose concentrations in a patient with mildly…
A: Given that The data are 16.67, 16.66, 16.64, 16.30, 16.31, 16.70
Q: Which of the following are the values of the chi-square statistic and P-value?
A:
Q: The following data relates to the sizes of shoes sold at a store during a given week. Find the…
A:
Q: Which of the following is NOT part of descriptive statistics? (A Collection data (B An inference…
A: We know that, The descriptive statistics consists collection of data , summarizing of data and…
Q: Q1: Define the following terms ( answer five only): Statistical data, Frequency Distribution…
A: Statistics is originated when man started to count, Comparing and keeping records in one or the…
Q: Which of the following is an unbiased point estimator of a population proportion? A. p-value В. р С.…
A: Introduction: Denote p as the true population proportion.
Q: Find the quartile deviation and coefficient of quartile deviation from the following table.
A: quartile deviation Q.D = Q3-Q12coefficient of Q.D = Q3-Q1Q3+Q1 for marks arrange the…
Q: Which of the following is a discrete quantitative variable for a randomly selected student at your…
A: Basics:
Q: Evaluate the first quartile 0, for the following data. 1. 54, 69, 24, 75, 77, 83, 95, 100, 35, 110 O…
A:
Q: 18. Which of the following measures describes how spread out the data is from the mean? O median O…
A: To determine which of the following measures describes how spread out the data is from the mean.1…
Q: Which of the following pairs of variables (attributes listed in parentheses) could be analyzed using…
A:
Q: The 3rd quartile for the dataset represented in the following boxplotis approximately what value?
A: We know that the Boxplot gives us five things of a dataset as Min_value, 1st quartile, Median,…
Q: Find the mode, mean, and standard deviation of the following data: 3, 2, 3, 4, 6
A: Given Data: Data Set: 3, 2, 3, 4, 6 There are five numbers in the given data set. So, n=5. There is…
Q: Which of the following is a biased estimator? a) Variance b) Mean c) Proportion d) Standard…
A: The statistics sample mean, sample variance and sample proportion targets the corresponding…
Q: . Which of the following about ordinal level of measurement is NOT true? O It classifies data in…
A: When the data set is distinguished on the basis of labelling variables that are qualitative in…
Q: within 3 standard deviations of
A: A) The Empirical Rule states that 99.7% of data observed following a normal distribution lies within…
Q: Which of the following measures is easily affected by extreme data or values? (A) Median (B Range C)…
A:
Q: The midterm exam grades of an engineering course were used to create the following stem and leaf…
A: We want to calculate the third quartile
Q: Which of the following figures is irrelevant in a chi square analysis? O Sample mean O Degrees of…
A: Degrees of freedom, sample size and number of variable categories are required in
Q: Consider the histogram shown below. 30 10 10 15 DATA (a) Is this data skewed to the right,…
A: A distribution skewed to the right is said to be positively skewed. This kind of distribution has a…
Q: use the data to calculate tukey test, Fisher LSD and Dunnet test
A: Given: Summer Shoulder Winter 83 91 94 85 87 91 85 84 87 87 87 85 90 85 87 88 86…
Q: Which of the following would be affected the most if there is an extremely larg value in the data…
A: Answer - Which of the following would be affected the most if there is an extremely…
Q: Approximate the mean for following GFDT. Data Frequency 60 - 64 1 65 - 69 2 70 - 74 4 75 - 79 10 80…
A: we know that mean =1/N ∑fx N=sum of frequency
Q: Calculate the mean deviation (from mean) from the following data :
A: Here use formula of mean deviation
Q: Find the following measures of dispersion using the following lists of average month temperatures of…
A: a) The data set with largest standard deviation having the more variability. Consider, the standard…
Q: In statistical analysis, there are a few key parameters. Describe the following a) Median b) Mean c)…
A: Solution
Q: Which of the following is the most appropriate measure of location for metric variables? O…
A: Definition: Metric Variable: It can be defined as Metric variables are variables that are measured…
Q: In the data set below, what is the upper quartile?
A:
Q: Construct a relative frequency histogram for the following 20 measurements on a discrete variable…
A: Given data are: The 20 measurements are: What proportion of the measurements are less than 2?
Q: Determine the following using the data table provided and show how you derived it: A) first…
A: The data given is 27,41,18,13,10,12,24,17,10,13,26,9,14,5,6,10,30,5,5,3,4,3,12,15,20,23,15,18,22,21…
Which histogram is correct given the following data points above?
What are the unusal values rounded to 2 decimal places?

Step by step
Solved in 2 steps with 1 images

- The U.S. Census Bureau reported that in 2015,the proportion of adult Americans age 25 and olderwho have a bachelor’s degree or higher is 0.325(“Educational Attainment in the United States:2015,” census.gov, retrieved January 22, 2017).Consider the population of all adult Americans age25 and over in 2015 and define 户to the proportionof people in a random sample from this populationwho have a bachelor’s degree or higher.a. Would 卢based on a random sample of only 10people from this population have approximatelya normal distribution? Explain why or why not.b. What 征e the mean value and standard deviation of户based on a random sample of size 400?c. Suppose that the sample size is n = 200 ratherthan n = 400. Does the change in sample sizeaffect the mean and standard deviation of thesampling distribution of 卢? If so, what are thenew values for the mean and standard deviation?If not, explain why not.A doctor is interested in the proportion of patients which live at least 5 years after being diagnosed with stage 4 breast cancer. He randomly selects 96 patients diagnosed with stage 4 breast cancer and follows them for 5 years. Suppose the true 5 year survival rate for stage 4 breast cancer is 25%. How are the collection of all sample proportions of samples of size 96 distributed?N(, ) What is the probability that fewer than 22% of the patients studied survived for at least 5 years? List the zz-scores needed to calculate the result. If there is more than one zz-score, separate the values with a comma. There is a chance that fewer than 22% of the patients studied survived for at least 5 years. What is the probability that more than 33% of the patients studied survived for at least 5 years? List the zz-scores needed to calculate the result. If there is more than one zz-score, separate the values with a comma. There is a chance that more than 33% of the…In the midst of labor–management negotiations, the president of a company argues that the company’s blue-collar workers, who are paid an average of $30,000 per year, are well paid because the mean annual income of all blue-collar workers in the country is less than $30,000. That figure is disputed by the union, which does not believe that the mean blue-collar income is less than $30,000. To test the company president’s belief, an arbitrator draws a random sample of 350 blue-collar workers from across the country and asks each to report his or her annual income. If the arbitrator assumes that the blue-collar incomes are normally distributed with a standard deviation of $8,000, can it be inferred at the 5% significance level that the company president is correct? ONLY USE EXCEL AND PLEASE SHOW ALL STEPS AND EXCEL COMMANDS. Incomes 29109 21546 30417 10104 19279 27578 23581 26949 35423 12971 37895 31308 28256 31494 31552 34440 33347 26768 25225…
- During the recovery from the Great Recession of 2007-2009, the economic situation for many familiesimproved. However, in 2011 the recovery was slow and it was uncertain as to how much had reallychanged on the national level. To estimate the national average of the percent of low-income workingfamilies, a representative simple random sample of the percent of low-income working families from eachof the country’s reporting jurisdictions could be used to calculate a point estimate and create a relatedconfidence interval. With this confidence interval a better picture of the nation’s recovery can be had andlegislative decisions can be made.6. Describe in two or three sentences how a simple random sample of size n=20 could be obtainedfrom the full list of jurisdictions provided for use with this assignment.7. A researcher reported that a sample of size n=30 produced a sample mean of 32.56% and a samplestandard deviation of 6.56%. Use this information to calculate a 90% confidence interval…‘Churn’ is a term used to describe the rate at which a company loses customers to itscompetitors. In the telecommunications industry, it is believed that the churn ratebetween cellphone service providers (e.g. Vodacom, MTN, Virgin Mobile, 8.ta andCell C) is not more than 15%.A telecommunications analyst surveyed a random sample of 560 cellphone subscribersand found that 96 of them had changed service provider within the past year.(a) Is there sufficient statistical evidence at the 10% significance level to concludethat the churn rate in the telecommunications industry exceeds 15%? Performa hypothesis test for a single proportion and report the findings.(b) compute the p-value for the test.Interpret the findings for the telecommunications analyst.