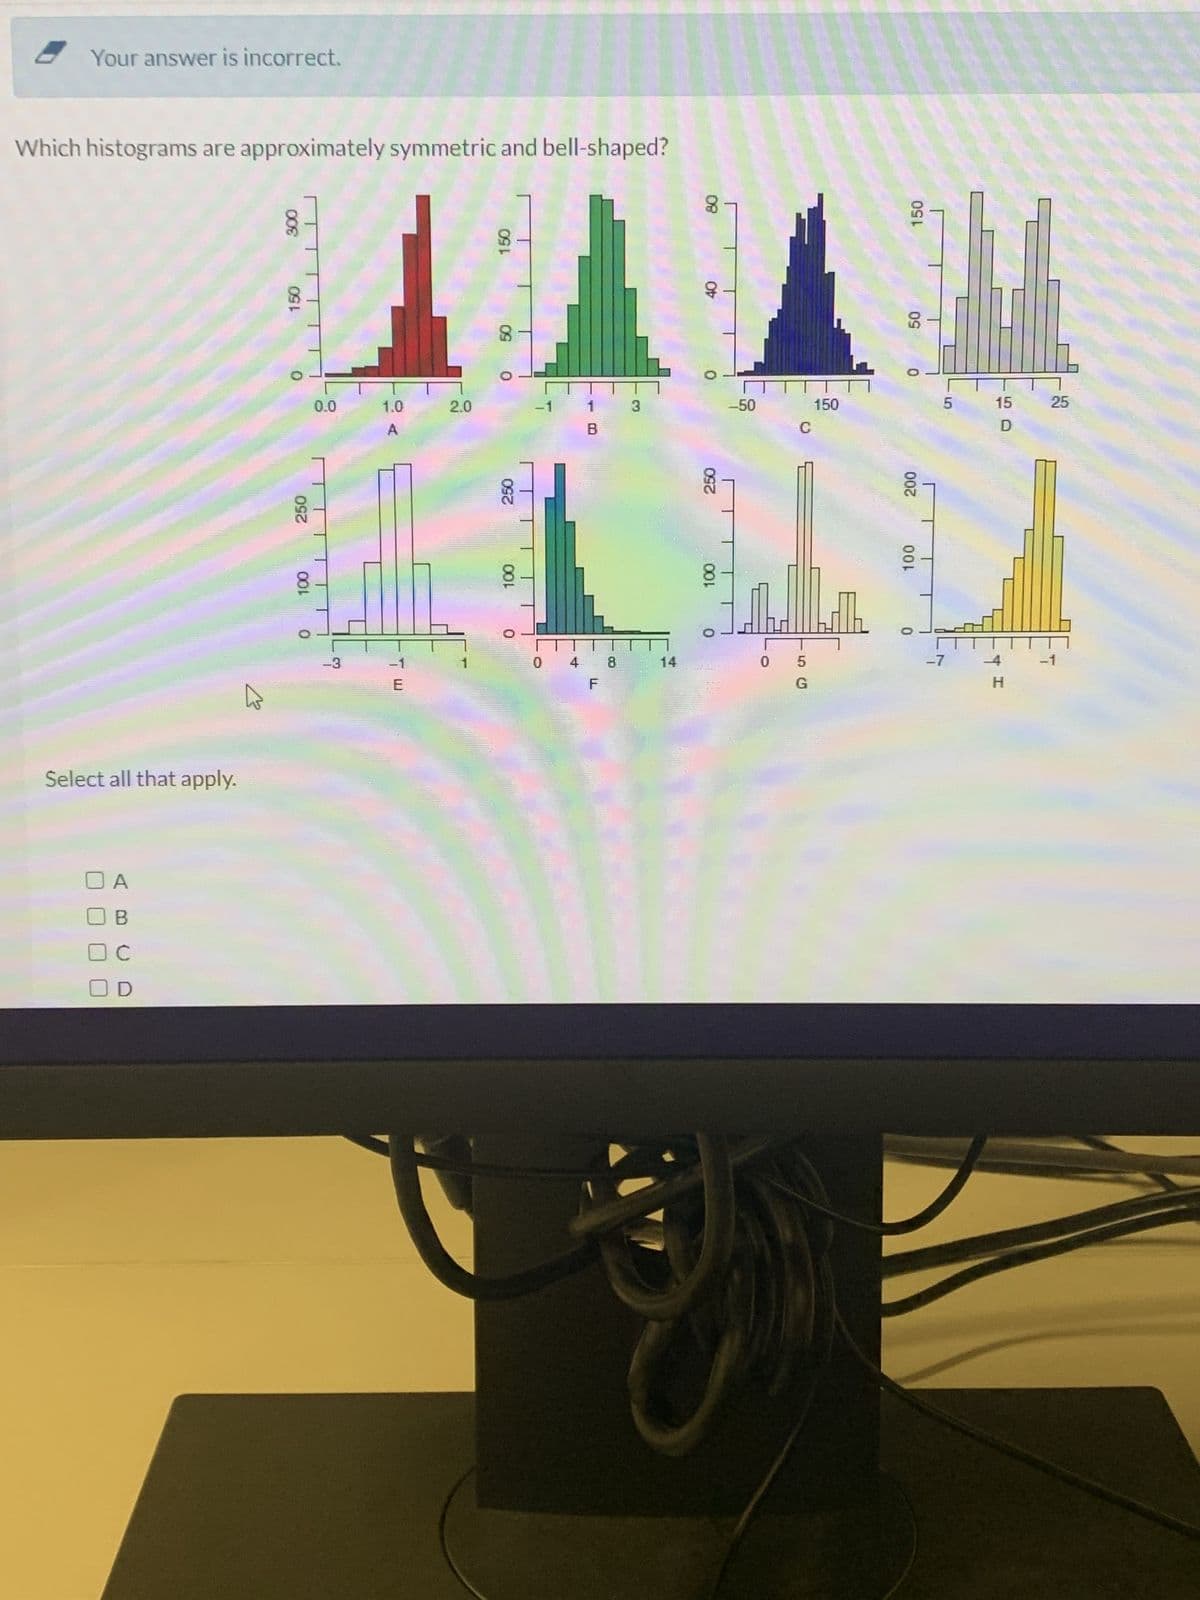
Which histograms are approximately symmetric and bell-shaped? 2 300 150 0 TT 250 100 0.0 TTTTTT 0 ורט -3 -! 204 1.0 A -тш -1 E 2.0 1 09 O 092 100 O TTTTT B 8 3 250 100 0 -50 Lo T5G 150 F 150 50 0 200 100 U 5 15 D 25


Q: Insurance status-covered (C) or not covered (N)-is determined for each individual arriving for…
A: Insurance status:C- CoveredN- Not coveredThe events and probabilities are given as
Q: create a graph and make the forecast described. Create graph: 1) Use one series of data (one line)…
A: Given the Ice cream demand data…
Q: n a new card game, you start with a well-shuffled full deck and draw 3 cards withoutreplacement. If…
A: The objective of this question is to create a probability model for a card game, calculate the…
Q: The average stock price for companies making up the DAX in Germany is $40, and the standard…
A: Mean()=40standard deviation()=4
Q: The Acme Company manufactures widgets. The distribution of widget weights is bell-shaped. The widget…
A: The question is about empirical rule.Given :Mean widget weight ( ) = 51 ounces.Standard deviation…
Q: the probaility that a person in the US has type B+ blood is 11%. 4 unrelated people are slected at…
A: Sample of size(n)=4p=the probability that a person in US has type B+ blood=0.11q=1-pq=1-0.11=0.89A…
Q: Airline passengers arrive randomly and independently at the passenger screening facility at a major…
A: "Since you have posted a question with multiple subparts we will provide solutions only to the first…
Q: Speed data collected on an urban roadway yielded a standard deviation in speeds of 4.8 mi/h. (a) If…
A: From the provided information,Confidence level = 95%Margin of error (E) = 2
Q: You want to estimate the average size of the shoes of kids going to your bowling alley so you can…
A: Given:Sample size (n) = 8Data: 2,3,4,5,6,6,7,7Mean = 5
Q: A flight travels daily from Pittsburgh to San Antonio. The following list gives the arrival time…
A: The objective of the question is to identify which measures of central tendency (mean, median, mode)…
Q: A random sample of 14 health maintenance organizations (HMOs) was selected. For each HMO, the…
A: 44,55,55,54,51,43,40,59,58,53,56,49,26,34sample size(n)=14Confidence level=90%
Q: Use the Normal model N(100,20) for the IQs of sample participants. a) What IQ represents the 15th…
A: The objective of this question is to find the IQs that represent the 15th and 96th percentiles and…
Q: Based on the frequency distribution below, what would the cut-off score be if only the top 10% of…
A: The given information states that thefrequency distribution of students based on the score is…
Q: Let X1 and X2 be independent random variables from a normal distribution with mean equal to one and…
A: X1,X2 are independent normal random variables, N(1,12)Objective : Find the distribution of…
Q: The salary of a maths teacher is normally distributed with a mean of £34000 and a standard deviation…
A: Mean()=34000standard deviation()=13500
Q: (a) Given that X∼N(18,22) Find, (i) P(X6.2) Answer:Round your answer to 4 decimal places.Your…
A: From the information, given that(a)Let X denotes the random variable which follows normal…
Q: The average scores for 16 participants is 128, with SD of 49.7 Calculate 95 % Confidence Interval,…
A: From the provided information,Confidence level = 95%
Q: The data shown below represents the number of pies sold by a bakery over a 1 year period (52 weeks).…
A: The data shown below represents the number of pies sold by a bakery over a 1 year period (52 weeks):…
Q: (a) Construct a two-sided 100(1 — a)% confidence interval for the difference µx − µy. (b) We want to…
A: and they are independent. are known.It is required to compute the confidence interval for the…
Q: (b) Now consider the summary data for the men who participated in the study. (1) Treatment A…
A: We have given the data for the men who participated in the studySurvivedDiedTotalTreatment…
Q: In a survey, 8 people were asked how much they spent on their child's last birthday gift. The…
A: The sample size, i.e., the sampled number of people, n=8.The sample mean, x¯=$37.The sample standard…
Q: A student randomly guesses at 7 multiple choice questions. Each question has five possible answers.…
A: The objective of this question is to find the probability of a student guessing exactly 3 correct…
Q: Skewed distributions are caused by --also known as extreme values.
A: Skewed distributions: When the points or observations in the data set fall far away from…
Q: How would you describe the relationship between mean call-to-shock time and survival rate? O There…
A: Here the dependent variable (y) = survival rateThe independent variable (x) = mean call to shock…
Q: Bus left on time Bus left late Bus Stop #1 12 25 TOTAL If one bus is randomly chosen: Bus Stop #2 24…
A: Bus Stop #1Bus Stop #2Bus Stop #3 Bus Stop #4Bus left on time12241821Bus left late25131916
Q: Suppose you are to create a frequency distribution with 6 intervals, that includes datapoints with a…
A: The number of classes in the frequency distribution table is 6The total data points = 86The smallest…
Q: What is the population variance of the following data set? Answers should be correct to two decimal…
A: The given observations are as follows:79, 96, 87, 80, 67Consider xi as each of the individual…
Q: A random sample of 16 undergraduate students receiving student loans was obtained, and the amounts…
A: A normal distribution is a distribution i.e., a bell-shaped curve. The total area of this…
Q: 54% of the population will say "yes" to a question (if asked). What is the population proportion, p?…
A: If the question is asked, will answer yes.The sample size selected from the population with…
Q: You are a forester working for Shenandoah National Park studying the diameter of oak trees You…
A: The question is about parametric inference.Introduction :Parameter : A quantity or a number which is…
Q: Interpret the following graphs for multiple linear regression and comment on the validity of model…
A:
Q: (a) Do the ratings meet the conditions needed for a two-sample confidence interval?
A: Arrange the rating of data as follows by beaking year-wise.Rating-2000…
Q: 5. Help for Insomniacs. In Exercise 1.23, we learned of a study to determine whether just one…
A: No. of people diagnosed with insomniaThere are group divisions of each by random selection. group…
Q: Students at a major university are complaining of a serious housing crunch. They complain that many…
A: The objective of the question is to find the percentage of commute distances that lie within certain…
Q: Unlock 5+ premium features for 7 days free 2. To estimate how often someone runs a red light in…
A: [Note: “Since you have posted multiple questions, we will provide the solution only to the first…
Q: Is that above or below average
A: The calculated z-score is as follows :-z=−0.625
Q: x probability -250 0.07 -100 0.09 0 0.21 75 0.31 150 0.24 275 0.06 400…
A: xP(x)-2500.07-1000.0900.21750.311500.242750.064000.02
Q: Suppose that a box contains 6 cameras and that 3 of them are defective. A sample of 2 cameras is…
A: The objective of the question is to find the probability distribution for the random variable X,…
Q: Suppose that you roll two fair 12-sided dice and X is the sum of the two numbers you get (assume…
A: When rolling two fair 12-sided dice.The possible outcomes are 122=144Let event X be defined as the…
Q: Suppose the number of years that a computer lasts has density f(x) = 8x³ if x ≥ 2. a) What is the…
A: A per our guidelines we are supposed to answer only three subparts kindly post the remaining…
Q: selected to start them on this diet for 3 months. Based on this information, can it be stated that…
A: Given data and calculation for mean and sample standard deviation is shown below
Q: ABC Corporation is considering three options for managing its data processing operation: continuing…
A: Given information is,ABC Corporation is considering three staffing options for managing its data…
Q: Approximately 23% of the calls to an airline reservation phone line result in a reservation being…
A: proportion of the calls to airline reservation phone line result in a reservation being…
Q: Exercise 3.2 Three circled areas and 2 pointers note analytical problems are shown by the patterns…
A: Control charts are indispensable tools in statistical quality control, offering insights into…
Q: Find the 10% trimmed mean of the following data. If necessary, round to one more decimal place than…
A: 0.29, 0.33, 0.38, 0.44, 0.45, 0.47, 0.47, 0.49 ,0.50, 0.50, 0.54, 0.54, 0.58, 0.60 ,0.61, 0.65,…
Q: Q2. The probability density function of X is as follows. f(x) = 2 - 2x, for x = [0, 1] Which one of…
A: The probability density function of X is given by,We need to find,
Q: can have a mean weight of up to 3600/25=144 pounds. Assume that weights of males are normally…
A: Answer By using the standard normal distribution,The population mean = 178The population standard…
Q: The distribution in this histogram has which of the following characteristics? (Don't worry if you…
A: The histogram gives an idea about the distribution.
Q: A store has the following demand figures for the last four years: Year 1 2 3 4 Demand 100 150 112…
A: The store's demand figures for the last years:The demand forecast for year The trend forecast for…
Q: According to the 2018 General Social Survey (n = 1014) , respondents watched about 2.97 hours of TV…
A: The mean is 2.97 hours and the standard deviation is 3.00 hours.

Step by step
Solved in 3 steps with 3 images

- A professional golfer is shopping for a new brand of golf ball. She likes most of the features of one particular brand, but she wants to make sure that the brand has a desirable spin rate (the rate at which the ball spins on its axis after being struck by a golf club). To test the spin rate of this new brand of ball, the golfer hits the brand of ball on 76 shots, and a computer measures the spin rate for each shot. The computer then produces the following histogram summarizing the 76 spin rates. 25 20 15 10 5 0 Frequency 4 12 13 22 19 6 5000 5500 6000 6500 7000 7500 8000 Spin rate (in revolutions per minute) Based on the histogram, estimate the mean spin rate (in revolutions per minute) for the sample. Carry your intermediate computations to at least four decimal places, and round your answer to the nearest integer.Which value of r indicates a stronger correlation than +0.40 0.38 -0.30 -0.80 0Compute the Correlation Coefficient r, to identify whether there is a relationship between the two variables (Summative 1 and Summative 2 scores). x (1st Summative Test Scores) y (2nd Summative Test Scores) 25 25 25 25 25 25 16 15 25 25 15 25 23 25 25 25 15 13 23 20 Please type the answer or write it in a clearer format
- Because the data in this chart are displayed as a line with no data point markers, this indicates that the dependent variable data are A) Measured (or Empirical), Numeric B) Theoretical (or Calculated), Numeric C) Measured (or Empirical), Categorical D) Theoretical (or Calculated), CategoricalWhich of the scatter diagrams below suggests a strong positive linear relationship between the x and y variables?Which of the scatterplots in the picture show each other the following? a) no association? b) a negative association? c) a linear association? d) a weak or moderate association? e) a very strong association?
- Compute the Correlation Coefficient r, to identify whether there is a relationship between the two variables (Summative 1 and Summative 2 scores). x (1st Summative Test Scores) y (2nd Summative Test Scores) 25 25 25 25 25 25 16 15 25 25 15 25 23 25 25 25 15 13 23 20A student has taken 4 area exams designed to measure particular intellectual abilities. The following table identifies each test, summarizes its characteristics, and provides the student’s score on it. Assume that the possible scores on each test are normally distributed. Area Test ? ? Student’s Score Verbal Ability 58.50 6.50 63.00 Visualization 110.00 15.00 102.50 Memory 85.00 11.50 98.00 Spatial Relations 320.00 33.50 343.00 a. Change each student’s score to its z-score equivalent b. On which test did the student score in the highest position? c. On which test did the student score in the lowest position? d. What is the percentile rank of the student’s Verbal Ability? e. What percentage of the students who took the Spatial Relations test scored higher than the student? f. Between what two scores on Memory did the middle 95% of students lie? g. What percent of students had scores between X = 95 and X = 110 on Visualization?Six data points are given in the table below. Which statement identifies the correlation coefficient between the two variables and the correct interpretation of the correlation coefficient as a measure of the strength of the linear association? r=0.9591 ; The correlation coefficient indicates a weak, positive, linear correlation. ⊝ r=0.9199 ; The correlation coefficient indicates a strong, negative, linear correlation. ⊝ r=0.9591 ; The correlation coefficient indicates a strong, positive, linear correlation. ⊝ r=0.9199 ; The correlation coefficient indicates a weak, negative, linear correlation.
- Suppose that a customer is purchasing a car. He conducts an experiment in which he puts 10 gallons of gas in the car and drives it until it runs out of gas. He conducts this experiment 15 times on each car and records the number of miles driven. Full data set Car 1 216 243 205 242 239 297 295 172 270 251 165 310 265 316 278 Car 2 231 220 223 205 245 257 242 292 248 252 287 255 250 293 251 ..... Describe each data set, that is determine the shape, center, and spread. Sample mean for Car 1 x=__________mi / 10 gal (Type an integer or decimal rounded to one decimal place as needed.) Sample mean for Car 2 x=___________mi / 10 gal (Type an integer or decimal rounded to one decimal place as needed.) Median for Car 1 M=____________mi / 10 gal (Type an integer or decimal rounded to one decimal place as needed.) Median for Car 2 M=___________mi / 10 gal (Type…Which of the following scatter plots that true linear association?Write the equation of the line for predicting Sales (Y) using the amount of Advertising (X) as the pre- dictor. Find the correlation and use it to make a statement, in your own words, about the quality of the predic- tion line. Advertising dollars Sales 5.5 100 5.8 110 6.0 112 5.9 115 6.2 117 6.3 116 6.5 118 6.6 120 6.4 121 6.5 120 6.7 117 6.8 123 5.4 100 6.3 108 6.2 110 5.8 115 6.2 117 6.6 117 6.8 119 6.4 119 6.9 122 6.9 119 7.0 119 6.5 122
