One Quantitative Variable, Single Group Variable name: Temperature Input: Raw data Input data separated by commas or spaces. Data: 32 36 29 34 31 33 27 34 Begin analysis Edit inputs Reset everything Graph Distribution Graph type: [Dotplot Show boxplot 우 27 28 29 Export summary statistics Perform Inference T 30 O 31 Summary Statistics n mean SD min Q1 med Q3 max 8 32 2.928 27 30 32.5 34 36 T 32 Temperature of 33 T 34 T 35 ● Number of samples to add: The applet will graph all of your results until you hit "Reset simulation." Add samples Reset simulation 36 Inference procedure: [Simulate mean difference Applet assumes data values are differences from paired data. This procedure simulates the distribution of the mean difference when randomly shuffling the outcomes within each pair and calculating the difference for each pair. Adjust color, rounding, and percent/proportion preferences | Back to menu
One Quantitative Variable, Single Group Variable name: Temperature Input: Raw data Input data separated by commas or spaces. Data: 32 36 29 34 31 33 27 34 Begin analysis Edit inputs Reset everything Graph Distribution Graph type: [Dotplot Show boxplot 우 27 28 29 Export summary statistics Perform Inference T 30 O 31 Summary Statistics n mean SD min Q1 med Q3 max 8 32 2.928 27 30 32.5 34 36 T 32 Temperature of 33 T 34 T 35 ● Number of samples to add: The applet will graph all of your results until you hit "Reset simulation." Add samples Reset simulation 36 Inference procedure: [Simulate mean difference Applet assumes data values are differences from paired data. This procedure simulates the distribution of the mean difference when randomly shuffling the outcomes within each pair and calculating the difference for each pair. Adjust color, rounding, and percent/proportion preferences | Back to menu
Oh no! Our experts couldn't answer your question.
Don't worry! We won't leave you hanging. Plus, we're giving you back one question for the inconvenience.
Submit your question and receive a step-by-step explanation from our experts in as fast as 30 minutes.
You have no more questions left.
Message from our expert:
Writing assignments don't fall within the 30+ subjects covered in Ask an Expert. For writing help, please visit bartleby write. We've credited a question to your account.
Your Question:
Which is the best measure of central tendency (mean, median, or mode) and why?
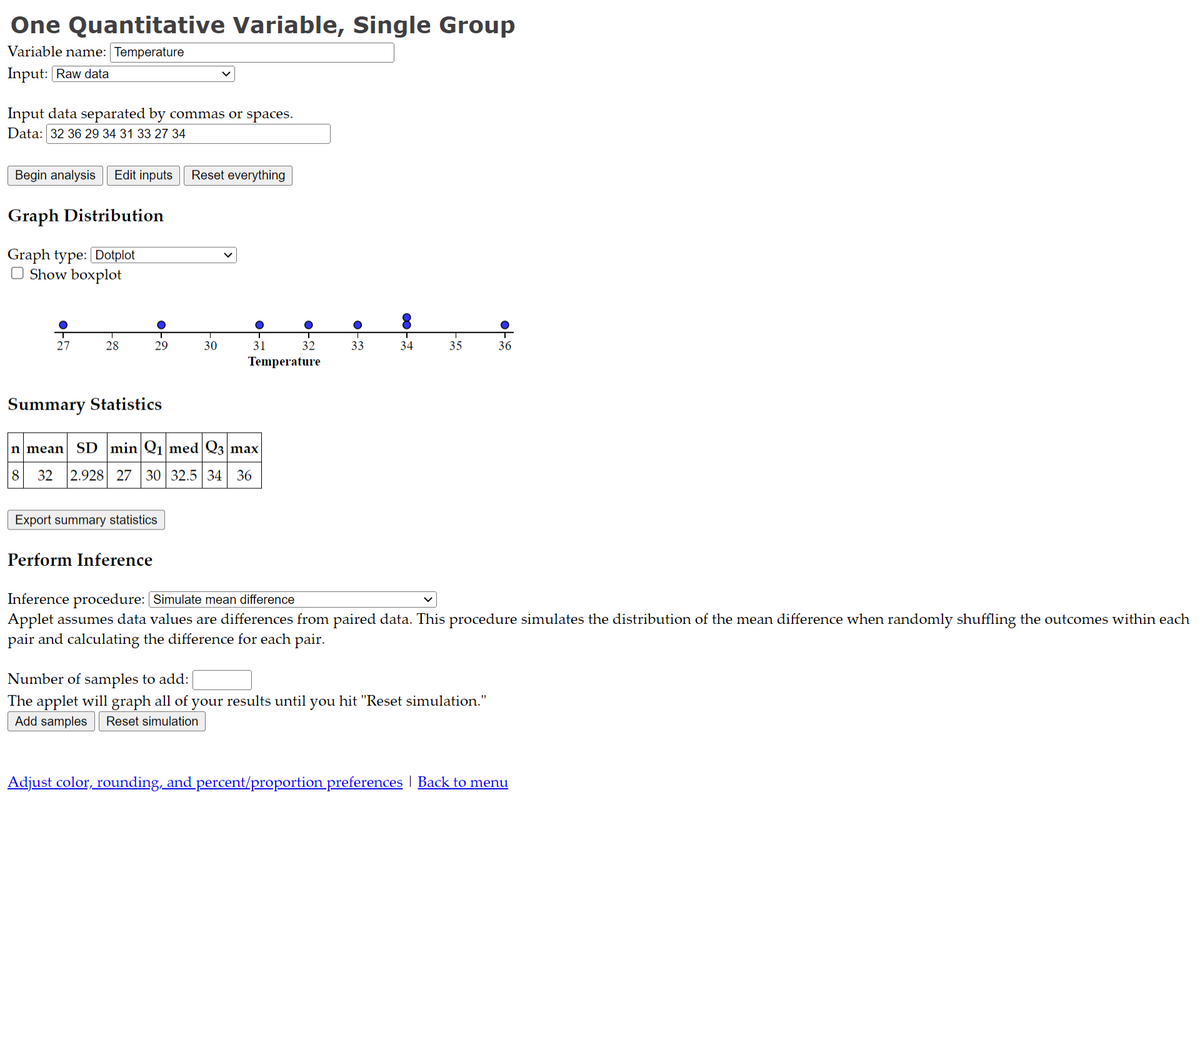
Transcribed Image Text:One Quantitative Variable, Single Group
Variable name: Temperature
Input: Raw data
Input data separated by commas or spaces.
Data: 32 36 29 34 31 33 27 34
Begin analysis Edit inputs Reset everything
Graph Distribution
Graph type: [Dotplot
Show boxplot
우
27
28
29
Export summary statistics
Perform Inference
T
30
O
31
Summary Statistics
n mean SD min Q1 med Q3 max
8 32 2.928 27 30 32.5 34 36
T
32
Temperature
of
33
T
34
T
35
●
Number of samples to add:
The applet will graph all of your results until you hit "Reset simulation."
Add samples Reset simulation
36
Inference procedure: [Simulate mean difference
Applet assumes data values are differences from paired data. This procedure simulates the distribution of the mean difference when randomly shuffling the outcomes within each
pair and calculating the difference for each pair.
Adjust color, rounding, and percent/proportion preferences | Back to menu

Recommended textbooks for you

Glencoe Algebra 1, Student Edition, 9780079039897…
Algebra
ISBN:
9780079039897
Author:
Carter
Publisher:
McGraw Hill

Big Ideas Math A Bridge To Success Algebra 1: Stu…
Algebra
ISBN:
9781680331141
Author:
HOUGHTON MIFFLIN HARCOURT
Publisher:
Houghton Mifflin Harcourt

Holt Mcdougal Larson Pre-algebra: Student Edition…
Algebra
ISBN:
9780547587776
Author:
HOLT MCDOUGAL
Publisher:
HOLT MCDOUGAL
Glencoe Algebra 1, Student Edition, 9780079039897…
Algebra
ISBN:
9780079039897
Author:
Carter
Publisher:
McGraw Hill
Big Ideas Math A Bridge To Success Algebra 1: Stu…
Algebra
ISBN:
9781680331141
Author:
HOUGHTON MIFFLIN HARCOURT
Publisher:
Houghton Mifflin Harcourt
Holt Mcdougal Larson Pre-algebra: Student Edition…
Algebra
ISBN:
9780547587776
Author:
HOLT MCDOUGAL
Publisher:
HOLT MCDOUGAL