

Q: Assume that (a, b) is a point on the graph of f. What is the corresponding point on the graph of the…
A:
Q: Use transformations of the graph of y = x4or y = x5 to graph each function.
A:
Q: Which of the following tables which represent y as a function of x
A: To find out tables which represent y as a function of x To become a function, x value does not have…
Q: Complete the table using domain of {-2, -1, 0, 1, 2} for each function shown. f(x) = 3(2)* %3D x -2…
A: Given, fx =32x x ={-2,-1,0,1,2} We have to find the value of fx for the given x.
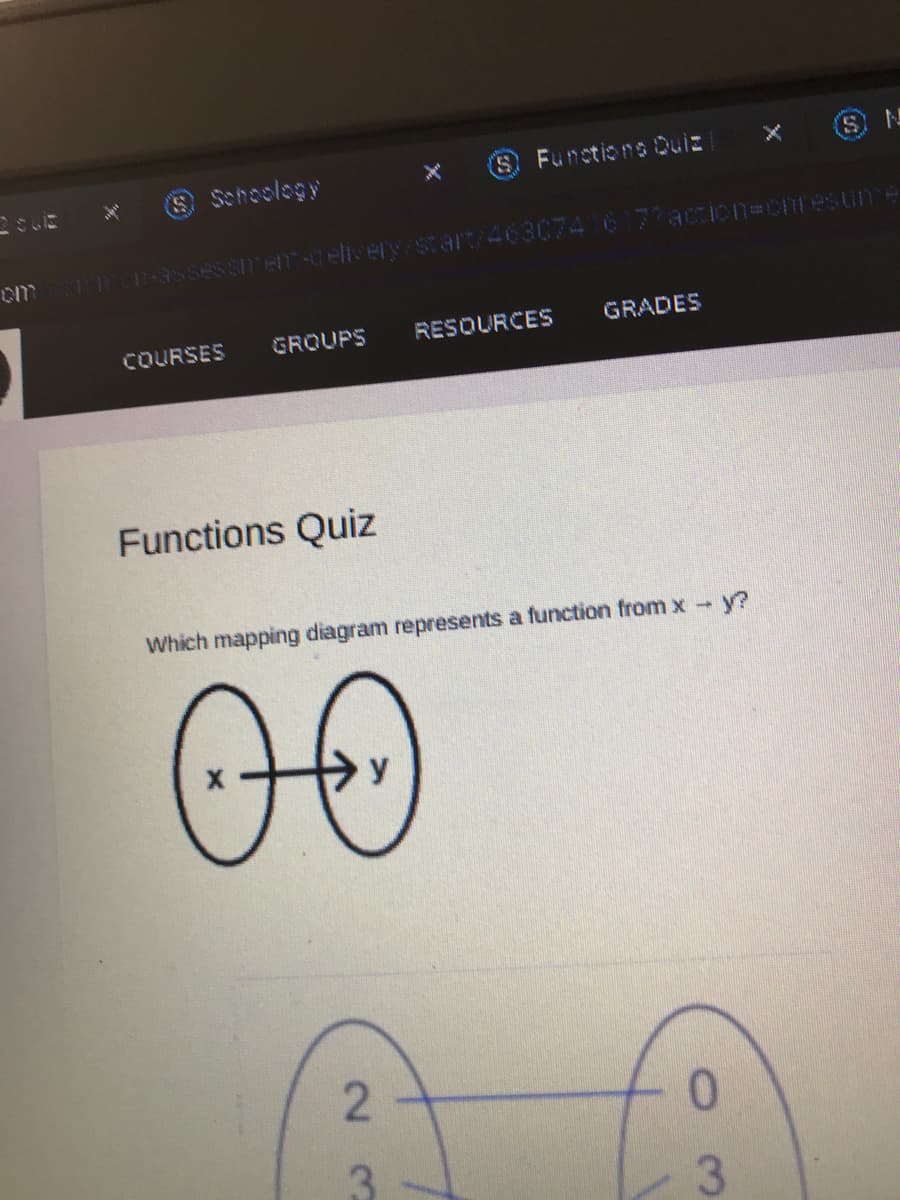
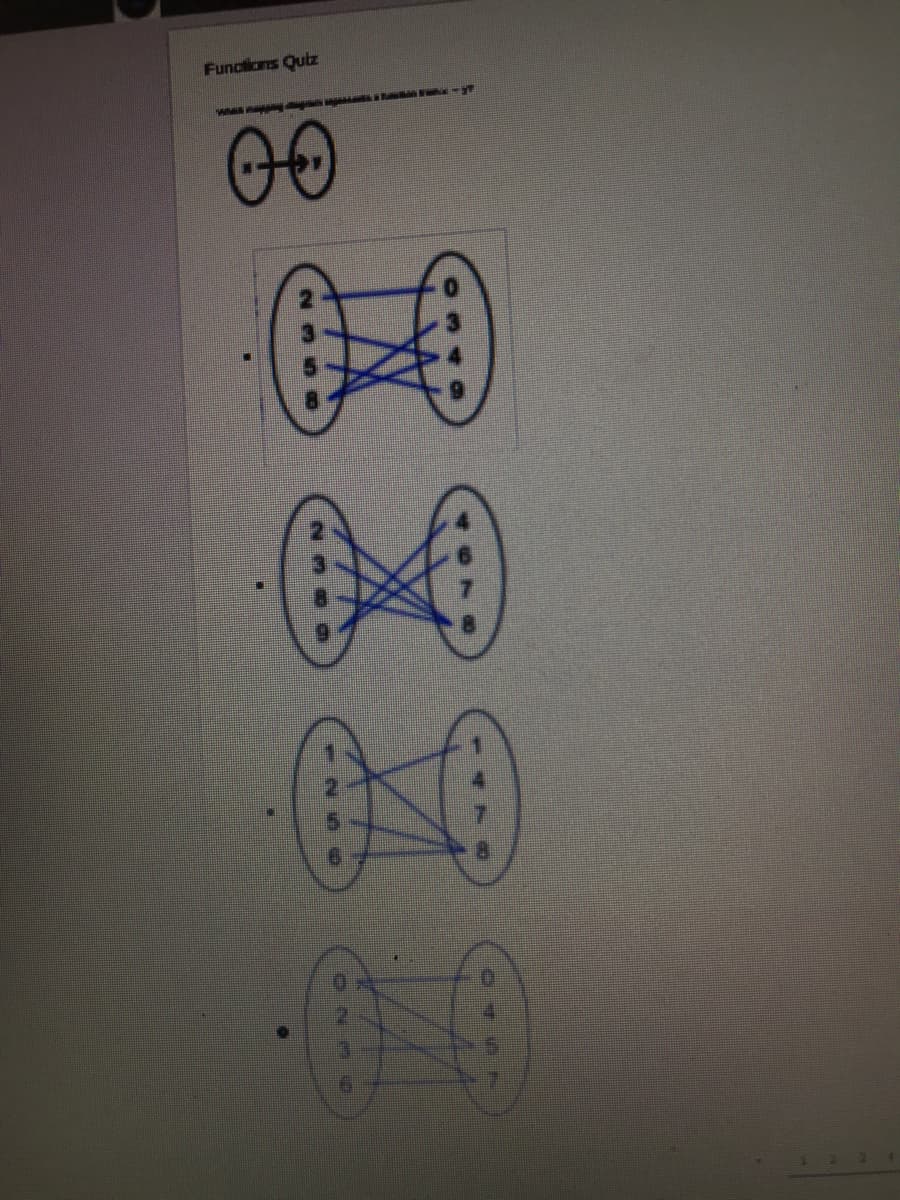
Q: Which of the following represents y as a function of x?
A: The following represents y as a function of x is
Q: Write f (x) as a piecewise function and sketch its graph |x – 1|
A:
Q: Use transformations of the graph of y = x4or y = x5 to graph each function.
A:
Q: Which of the following is an example of a parent function? O y = (x+ 3)2 – 1 %3D O y = O y = 1 + 17…
A:
Q: Use transformations of f(x) = x to graph the following function 9(x) = 2(x+3)² – 3
A:
Q: х2 — х + 1, 1 <x<2 Зх — 3, 2 <x<3 f(x) = -
A:
Q: Use the following graph of f(x) to describe the behavior of f '(x). State where f '(x) is positive,…
A: Given Graph of the function
Q: Use transformations of f(x) =x to graph the following function. h(x) = (x + 3)? +6
A:
Q: . Which graph does NOT represent yas a function of x? A B C D to
A:
Q: Give the domain of each function defined as : ƒ(x) = 2x
A:
Q: h(x)
A: We have to find domain of given function, h(x)=3x-12
Q: Use the function f(a) to fill in the table:
A: Given :
Q: Use transformations of the graph of y = x4or y = x5 to graph each function.
A: The graph of y=x4 can be used to graph the function f(x)=-x4. So, first we need to graph y=x4.…
Q: Use transformations of f(x) = x to graph the following function. g(x) =x² – 3
A:
Q: Decide whether the relation defines y as a function of x. Then give the domain. x=y6
A:
Q: Let f(x) be the function graphed below.
A: Given data: The given graph. The expression for the inequality is, f(x)≤2 The value of x when…
Q: Use the given function f to answer parts (a) through (f) below. f(x) = - 3+ In x
A:
Q: Use transformations of the graph of y = x4or y = x5 to graph each function.
A: To graph the function: fx=x-15+2
Q: Let f(x) = x° If g(x) is the graph of f(x) shifted left 4 units, write a formula for g(x) g(x)=…
A:
Q: State if the following functions are even or odd and show why they are even or odd by using a…
A: Given: y=x2+4
Q: State the transformation that occurs and then sketch of function f(x) = Vx-1+4
A:
Q: Which of the functions graphed are one-to-one, andwhich are not?
A: From the graph we can see that, y=0 when 0≤x<1y=1 when 1≤x<2y=2 when 2≤x<3& so on.
Q: 1. Explain whether each relation is a function. a) b) c)
A: Where we have to check the given relation is function or not
Q: Let f(æ) = xª If g(x) is the graph of f(x) shifted up 4 units, write a formula for g(x) g(x)=…
A:
Q: Use transformations of f(x) = Vx to graph the following function. h(x) = Vx-3-5
A:
Q: Use the following graph of the function f(x) to draw f'(x) and f''(x).
A: Given: Graph of the function f(x) is shown as:
Q: Does this mapping show y as a function of x? How can you tell? (Type your answer below.) 4
A: a mapping is function if domain has exactly one image
Q: Use transformations of f(x)= x to graph the following function. h(x) - - 6
A: Given function is fx=x3. To transform the above function to hx=-x+63. Since the transform function…
Q: Decide if the function is odd, even, or neither using definition f(x) 22 3x
A: Refer to the question.To check whether the function is even if f(-x) =f(x) for all real value of x…
Q: Which graph represents the function? (z+2)? ifz 1
A:
Q: Which transformations to f(z) would result in the graph of f'(x)? Graph: f '(x)
A: Known fact: The graph of y=fx-a, a>0 can be obtained by shifting the graph y=fx left side by a…
Q: B A В
A:
Q: Manipulate the graph to display the inverse of y = f(x) by dragging each given point on y = f(x) to…
A:
Q: Determine which of the following relations is a function.
A: A function is a relation for which each value from the set the first components of the ordered pairs…
Q: Use the vertical line test to determine if y is a function of x in the graph. Which of the following…
A:
Q: D. 3. to 3. 12 16
A: Recall: One to One function : One to one function is define that each element of one set is mapped…
Q: Find the domain and range of the relation R given below:
A: Given, R=-15,-6,-3,9,12,0,16,1
Q: Determine if the function is odd, even, or neith 7. f (x)= Vx
A: To show if the given function is even or odd or neither
Q: Identify whether the following relation is a function or not. a. y = -9x – 7 b. y = ±Vx с. у %3D х?…
A: As per Bartley guidelines we are supposed to answer only three subparts of one question. This…
Q: Complete the description of the piecewise function graphed below. bi if f(z) = if 21 <3 if 3<r< 6
A: Given that: Graph of f(x)
Q: Use the following graph of a function f to determine y to the nearest integer for y = f(4). y=9…
A: Given: The graph of y=fx To find the value of y=f4 To solve the problem by using some simple…
Q: Let f(x) = x4 If g(x) is the graph of f(x) shifted left 6 units, write a formula for g(x)
A:
Q: ? What is the domain of the function h(x)=
A:
Q: Which of the functions graphed are one-to-one, andwhich are not?
A: Given : The function graphed is : y=f(x)=-3x3 We have to determine the given function is one -one…
Q: which of the following functions has its domain identical with its ragge? a) Ix! b) x2 C) x3
A:


Trending now
This is a popular solution!

Step by step
Solved in 2 steps with 5 images


- A company is keen on investing in expanding its market penetration in Africa opening an on-line shop to new potential African clients. For this reason, the company wants to understand the level of digital divide, measured by the total number of internet users in relation to total population, as a function of clients’ personal characteristics. Considering the following analysis based on a survey conducted in two main markets, Nigeria and Kenya, we have the following information to estimate the digital divide: Age: respondent’s age from 25 to 55 years old. Gender: 1 female, 0 male. Education level measured as years of schooling. Region: Kenya =1, Nigeria =0. As part of their work they have produced the following linear regression. How well does the model “describe/explain” the digital divide? How would you improve the model? Is the model statistically significant?A company is keen on investing in expanding its market penetration in Africa opening an on-line shop to new potential African clients. For this reason, the company wants to understand the level of digital divide, measured by the total number of internet users in relation to total population, as a function of clients’ personal characteristics. Considering the following analysis based on a survey conducted in two main markets, Nigeria and Kenya, we have the following information to estimate the digital divide: Age: respondent’s age from 25 to 55 years old. Gender: 1 female, 0 male. Education level measured as years of schooling. Region: Kenya =1, Nigeria =0. As part of their work they have produced the following linear regression. Comment on the statistical significance, relative strength and direction of the relationships between the dependent variable and the independent variablesA company is keen on investing in expanding its market penetration in Africa opening an on-line shop to new potential African clients. For this reason, the company wants to understand the level of digital divide, measured by the total number of internet users in relation to total population, as a function of clients’ personal characteristics. Considering the following analysis based on a survey conducted in two main markets, Nigeria and Kenya, we have the following information to estimate the digital divide: Age: respondent’s age from 25 to 55 years old. Gender: 1 female, 0 male. Education level measured as years of schooling. Region: Kenya =1, Nigeria =0. As part of their work they have produced the following linear regression. How well does the model “describe/explain” the digital divide? How would you improve the model? Is the model statistically significant? Can we conclude that education definitely impacts on the digital divide? Justify your answer from a theoretical point…
- Which of values of x on this graph is the relative minimum?Show algebraically whether the given functions are injected or not.Life Expectancy at 65 Using data for selectedyears from 1950 and projected to 2050, the functiony = 0.077x + 13.827 gives the life expectancy atage 65, with y equal to the number of additional yearsof expected life at age 65 and x equal to the numberof years after 1950.a. Why is this a linear function?b. Find and interpret the slope of the graph of thisfunction.(Source: Social Security Administration)