Age: respondent’s age from 25 to 55 years old. Gender: 1 female, 0 male. Education level measured as years of schooling. Region: Kenya =1, Nigeria =0.   As part of their work they have produced the following linear regression. How well does the model “describe/explain” the digital divide? How would you improve the model? Is the model statistically significant?

Linear Algebra: A Modern Introduction
4th Edition
ISBN:9781285463247
Author:David Poole
Publisher:David Poole
Chapter7: Distance And Approximation
Section7.3: Least Squares Approximation
Problem 31EQ
icon
Related questions
Question

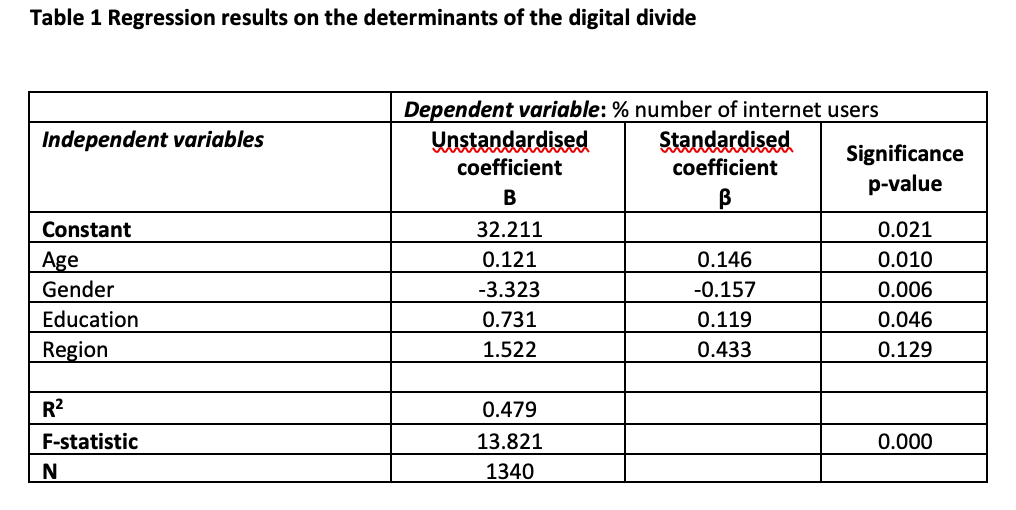
A company is keen on investing in expanding its market penetration in Africa opening an on-line shop to new potential African clients. For this reason, the company wants to understand the level of digital divide, measured by the total number of internet users in relation to total population, as a function of clients’ personal characteristics. Considering the following analysis based on a survey conducted in two main markets, Nigeria and Kenya, we have the following information to estimate the digital divide:


  • Age: respondent’s age from 25 to 55 years old.
  • Gender: 1 female, 0 male.
  • Education level measured as years of schooling.
  • Region: Kenya =1, Nigeria =0.


As part of their work they have produced the following linear regression.

How well does the model “describe/explain” the digital divide? How would you improve the model? Is the model statistically significant?

Table 1 Regression results on the determinants of the digital divide
Dependent variable: % number of internet users
Wostandardised
coefficient
Independent variables
Standardised
coefficient
Significance
p-value
B
Constant
32.211
0.021
Age
0.121
0.146
0.010
Gender
-3.323
-0.157
0.006
Education
0.731
0.119
0.046
Region
1.522
0.433
0.129
R2
0.479
F-statistic
13.821
0.000
1340
Transcribed Image Text:Table 1 Regression results on the determinants of the digital divide Dependent variable: % number of internet users Wostandardised coefficient Independent variables Standardised coefficient Significance p-value B Constant 32.211 0.021 Age 0.121 0.146 0.010 Gender -3.323 -0.157 0.006 Education 0.731 0.119 0.046 Region 1.522 0.433 0.129 R2 0.479 F-statistic 13.821 0.000 1340
Expert Solution
steps

Step by step

Solved in 3 steps

Blurred answer
Knowledge Booster
Research Ethics
Learn more about
Need a deep-dive on the concept behind this application? Look no further. Learn more about this topic, statistics and related others by exploring similar questions and additional content below.
Similar questions
  • SEE MORE QUESTIONS
Recommended textbooks for you
Linear Algebra: A Modern Introduction
Algebra
ISBN:
9781285463247
Author:
David Poole
Publisher:
Cengage Learning
Big Ideas Math A Bridge To Success Algebra 1: Stu…
Algebra
ISBN:
9781680331141
Author:
HOUGHTON MIFFLIN HARCOURT
Publisher:
Houghton Mifflin Harcourt