Which non-parametric test for ordinal data is the best to use in the given scenario? The wing stroke frequencies of two species of Rhinolophus bats implicated as possible origin for SARS virus were recorded for a sample of 4 Rhinolophus affinis (species 1) and 6 Rhinolophus Lacépéde (species 2). The wing stroke frequencies of the two species of bats are the following: specles 1-235, 225, 190, 188, species 2- 180, 169, 180, 185, 178, 182. Can you conclude that the distributions of wing strokes differ for these two specles? OWilcoxon Rank Sum Test OMood Median Test Sign Test Kruskal-Wallis Test Wilcoxon Matched-Pairs Signed-Ranks Test
Which non-parametric test for ordinal data is the best to use in the given scenario? The wing stroke frequencies of two species of Rhinolophus bats implicated as possible origin for SARS virus were recorded for a sample of 4 Rhinolophus affinis (species 1) and 6 Rhinolophus Lacépéde (species 2). The wing stroke frequencies of the two species of bats are the following: specles 1-235, 225, 190, 188, species 2- 180, 169, 180, 185, 178, 182. Can you conclude that the distributions of wing strokes differ for these two specles? OWilcoxon Rank Sum Test OMood Median Test Sign Test Kruskal-Wallis Test Wilcoxon Matched-Pairs Signed-Ranks Test

Glencoe Algebra 1, Student Edition, 9780079039897, 0079039898, 2018
18th Edition
ISBN:9780079039897
Author:Carter
Publisher:Carter
Chapter10: Statistics
Section10.3: Measures Of Spread
Problem 1GP

Related questions
Question
PLEASE ANSWER CORRECTLY
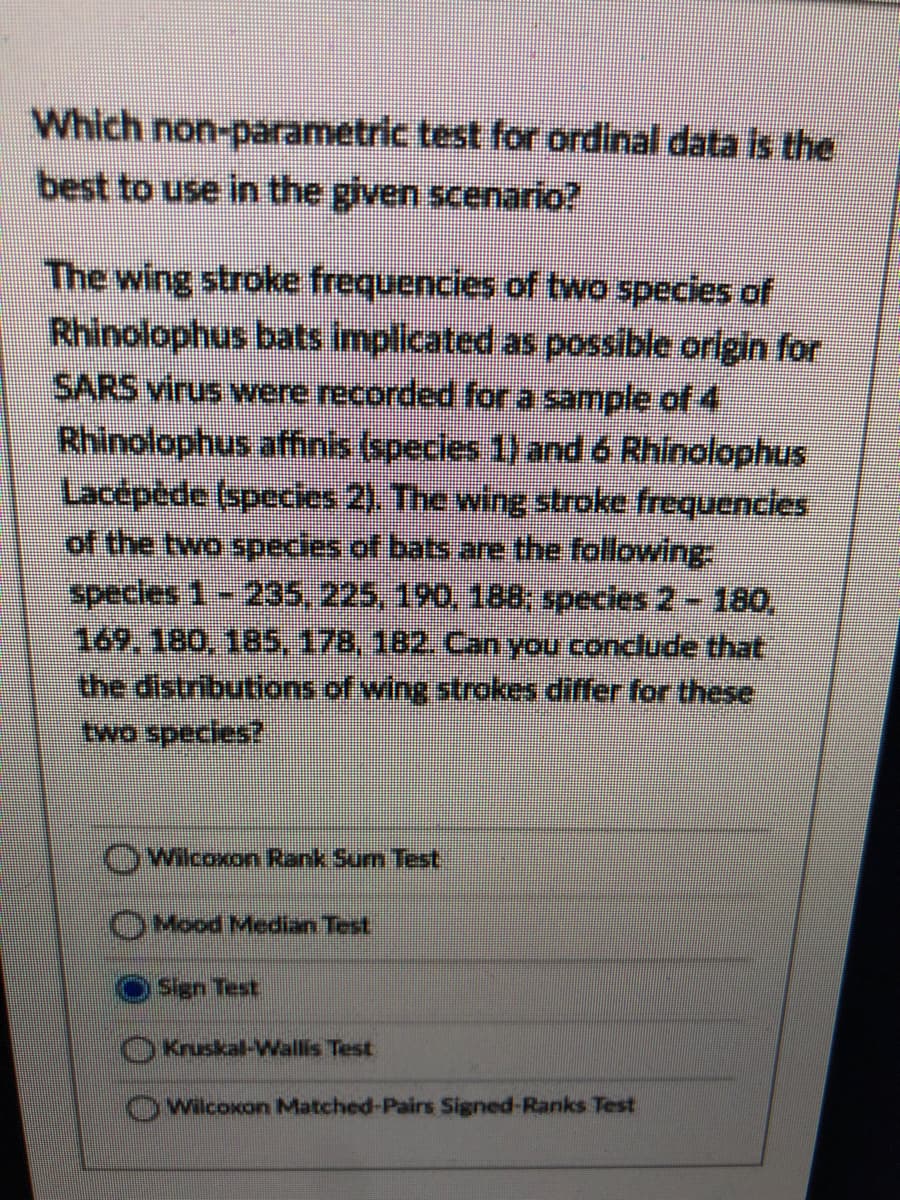
Transcribed Image Text:Which non-parametric test for ordinal data is the
best to use in the given scenario?
The wing stroke frequencies of two species of
Rhinolophus bats implicated as possible origin for
SARS virus were recorded fora sample of 4
Rhinolophus affinis (species 1) and 6 Rhinolophus
Lacepéde (species 2). The wing stroke frequencles
of the two species of bats are the following
specles 1-235, 225, 190, 188; species 2- 180,
169, 180, 185,178, 182. Can you conclude that
the distributions of wing strokes differ for these
two species?
OWilcoxon Rank Sum Test
OMood Median Test
Sign Test
Kruskal-Wallis Test
wilcoxon Matched-Pairs Signed-Ranks Test
Expert Solution
This question has been solved!
Explore an expertly crafted, step-by-step solution for a thorough understanding of key concepts.

Step by step
Solved in 2 steps

Recommended textbooks for you
Glencoe Algebra 1, Student Edition, 9780079039897…
Algebra
ISBN:
9780079039897
Author:
Carter
Publisher:
McGraw Hill
Glencoe Algebra 1, Student Edition, 9780079039897…
Algebra
ISBN:
9780079039897
Author:
Carter
Publisher:
McGraw Hill