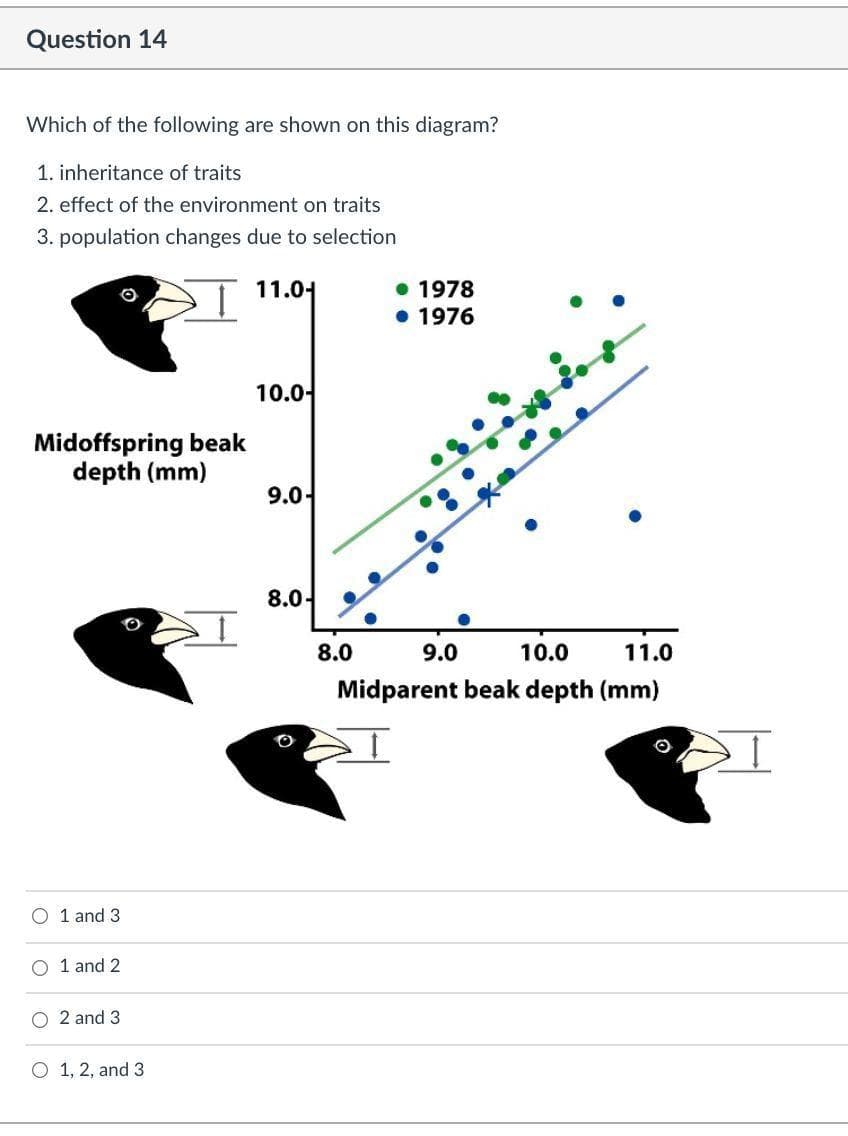
Which of the following are shown on this diagram? 1. inheritance of traits 2. effect of the environment on traits 3. population changes due to selection ST 11.04 • 1978 • 1976 10.0- Midoffspring beak depth (mm)


Q: Differentiate the terms in each of the following pairs a. etiology and pathogenesis b. infection and...
A: ANSWER;- a. Etiology is the study of the reason for a disease, though pathogenesis is the way where ...
Q: Biomolecules such as Such as utsimCarbohydrates amino acids DNA Oil for example monomer such as mono...
A: Biomolecules are the most important organic compounds in living creatures since they are involved in...
Q: A person who is walking down the street and encounters a large snarling dog may sense that he or she...
A: Introduction: A complex experience of consciousness, body sensations, and behaviour that reflects th...
Q: secretory pathway?
A: The secretory pathway refers to the endoplasmic reticulum, Golgi apparatus and the vesicles which tr...
Q: Based on your knowledge of genetics, how would you determine whether kanamycin or BASTA-resistant T2...
A: Kanamycin A, often known as kanamycin, is an antibiotic used to treat tuberculosis and severe bacter...
Q: ake place within your body are
A:
Q: Discuss the process of evolution through natural selection. What could happen to the ecosystem and a...
A: Evolution is the most fundamental and organizing principles of the biological sciences and as such i...
Q: In flies, long wings (W) are dominant to short wings (w). Two homozygous recessive flies are crossed...
A: Given: In flies, long wings(W) are dominant to short wings(w). Dominant traits are always expressed ...
Q: All of the following are parts of the honeybee's processing of honey EXCEPT:
A: The correct answer to this question is conversion of some glucose and fructose into sucrose. All hon...
Q: Which of these is a difference between Acclimation and Adaptation in most instances? (select all tha...
A: Acclimation: Acclimatization, also known as acclimation or acclimatisation, is the process by which...
Q: QUESTION 13 Suppose that the genes for the light chain of an IgG molecule, carry different 300 V seg...
A: Antibodies identify and interact with particular antigen sections known as epitopes or antigenic det...
Q: Which of the following statement is correct? a. In insertion mutation, an organic compound insert i...
A: Alternation of DNA sequence takes place in mutation which results in change in genotype and phenotyp...
Q: In which type of cross(es) can we apply and demonstrate the law of segregation and law of independen...
A: Law of independent assortment and law of segregation were introduced by Gregor Johann Mendel. Accord...
Q: How is understanding the external and internal anatomy help in promoting healthy lifestyle through m...
A: Anatomy It is defined as a branch of biology that deals with the identification and description of t...
Q: From what you have learned in Biology, why is membrane potential essential among plants and animals?
A: Membrane potential is the potential gradient which is created due to difference in electric potentia...
Q: Describe a future device that may be used to identify a bioterror agent
A: Bioterrorism is difficult to predict or prevent, reliable platforms to rapidly detect and identify b...
Q: Make a CONCLUSION The Microorganisms that will be studied in this course includes representatives o...
A: Microbes are so small that they can only be seen under a microscope. This includes a large range of ...
Q: Question 8 The invention of microscope pushed discoveries in biology to new heights. This shows how ...
A: Answer: The invention of microscope pushed discoveries in biology to new heights. This shows how tec...
Q: A classification given to a nose that is short, broad, and has a minimum projection; this nose is co...
A: Answer b) platyrrhine
Q: The nucleoside monophosphates are seen in metabolic pathways because their phosphoric anhydride bond...
A: Nucleoside Monophosphate is formed by binding of nitrogenous base to carbohydrate which is attached ...
Q: Charcot-Marie-Tooth disease (CMT)causes motor and sensory neuropathies of the peripheral nervous sys...
A: Charcot-Marie- Tooth decay is a genetically transmitted disease. These mutations can sometimes cause...
Q: List several risks associated with being overweight, and with being underweight.
A: Having proper weight or having the proper Body Mass Index is important for the physiological process...
Q: D. 6.The B blood-type allele probably originated in Asia and subsequently spread to Europe and other...
A: Aim: to know the concept about biological evolution, natural selection, genetic drift, analogy, and...
Q: Which of the following represents an example of a proteoglycan? attachment of several molecules of h...
A: Proteoglycans can be defined as the heavily glycosylated proteins (high molecular weight) found in t...
Q: Which statement is correct about the brain of bilingual and multilinguals?
A: The statements about the brain of bilingual and multilingual which hold true are as follows:- The l...
Q: A
A: Roots help in the attachment of the plant to the soil. Roots also conduct water and minerals to the ...
Q: Question 20 Which of the following always base pairs with a pyrimidine? A. H3C. D. NH2 NH NH В. NH2 ...
A: The genetic material controls the activities of the cell. It is made up of nucleotides sub units.
Q: Illustrate the basic steps in DNA extraction
A: DNA extraction is a procedure used to isolate DNA from the nucleus of cells. The purpose of DNA Extr...
Q: The difference between local and global sequence alignments is that local alignment
A: 3.option A Basic Local Alignment Search Tool (Blast ) one of the most common tools used to examine...
Q: Damaged DNA can be reversed if nucleotides can be replaced with a proper nucleotide for a correct am...
A:
Q: 7. In which region would you find the renal corpuscles (glomerulus + Bowman's capsule)?
A: In mammals, the kidneys are a pair of bean-shaped structures located in the peritoneal cavity just b...
Q: Question 8 Predominant nucleotides during protein synthesis are the GTPS. A) True B) False
A: In DNA genetic code stores the information in the form of triplet nucleotides and this information i...
Q: development of T-cells and B-cells
A: T cells are part of the immune system and develop from stem cells in the bone marrow. B cell is a ...
Q: A collection, or set of all individuals or objects or events whose properties are to be analyzed is ...
A: The study and use of statistical approaches to a broad variety of problems in biology is known as bi...
Q: Calculate K’eq and ΔG’0 for the following: A 0.1 M solution of glucose 1-phosphate at 25oC is incuba...
A: Keq is the equilibrium constant and it is a measure of ratio of concentration of products to reactan...
Q: Provide a proof that a different phenotype can be produced from the same genotype. What are the poss...
A: A phenotype is a set of observable characteristics about a person, such as height, eye colour, and b...
Q: H;C. NH QH HO-P=0 ÓH A True B) False
A: Thymidilic acid is a part of DNA. It is exclusively found in DNA and not in RNA. Thymine is a nitrog...
Q: What are the factors that could affect the ion movement?
A: Answer
Q: Correct statement regarding nucleotide structure A removal of the ribose-phosphate group from thymid...
A:
Q: chi-square
A: A chi-square statistic is a measure of the difference between the observed and expected frequencies ...
Q: How and why have humans changed animals over time through artificial selection?
A: Q. How and why have humans changed animals over time through artificial selection? Answer - Artifi...
Q: Explain Affinities of Gnetales.
A:
Q: A unique 5'CCA terminal sequence is found in all RNAS to be able to carry the correct amino acid to ...
A: The secondary structure of tRNA has a clover leaf appearance with three hairpin loops. The main cons...
Q: Homemade breads undergo spoilage called ropines. This is due to? Amylase Lipase Oxidase Cellulase
A: Aim: to know the cause of homemade bread spoilage, ropines. Ropines: bread spoilage that occurs due...
Q: The oxygenated and non-oxygenated blood of the arteries and veins that influence the color of the sk...
A: Lungs are essential parts of the respiratory system. A pair of lungs in humans are formed in such a ...
Q: Which of the following always base pairs with a pyrimidine?
A: Ans. A. B and C
Q: Question 26 The removal of a phosphate from cytidine yields the cytosine base. A True B) False
A: DNA consists of deoxyribonucleotide sub units. It is the genetic material in the cell.
Q: ndom mutations anywhere within the genome in living cells (in vivo) b) random mutati...
A: In research to create mutations it is very necessary to first decipher the type of organism in which...
Q: Name the four major classes of pesticides. What are the advantages and disadvantages of each type? C...
A: [As per our company guideline we are supposed to answer only first 3sub parts. Kindly repost other p...
Q: Diverse reactive chemicals are created inside the phagosome to kill/inactivate phagocytized microbes...
A: *phagosome means the vesicle that is formed around the microbe or the suspecious particle which was ...
Please answer fast

Step by step
Solved in 2 steps with 1 images


- Question 1.You have sampled a population in which you know that the percentage of the homozygous recessive genotype (aa) is 36%. Using that 36%, calculate the following: A) The frequency of the "aa" genotype. B) The frequency of the "a" allele. C) frequency of the a allele, then the frequency is 60%. Question 6A very large population of randomly-mating laboratory mice contains 35% white mice. White colouring is caused by the double recessive genotype, "aa". Calculate allelic and genotypic frequencies for this population. Question 7After graduation, you and 19 of your closest friends (lets say altogether 10 males and 10 females) charter a plane to go on a round-the-world tour. Unfortunately, you all crash land (safely) on a deserted island. No one finds you and you start a new population totally isolated from the rest of the world. Two of your friends carry (i.e. are heterozygous for) the recessive cystic fibrosis allele (c). Assuming that the frequency of this allele does not change as…Question 18 When fitness is lower at both extremes of phenotypic variation for a trait (e.g., the very largest and very smallest beaks in a bird population) than for the median value in a population, the predominant evolutionary force at work is called Group of answer choices Only 1 correct answer phenotypic selection stabilizing selection directional selection phenotypic choiceQuestion 1.You have sampled a population in which you know that the percentage of the homozygous recessive genotype (aa) is 36%. Using that 36%, calculate the following: A) The frequency of the "aa" genotype. B) The frequency of the "a" allele. C) frequency of the a allele, then the frequency is 60%. D) The frequency of the "A" allele. E) frequency of A is by definition equal to p, so the answer is 40%. F) The frequencies of the genotypes "AA" and "Aa." G)The frequencies of the two possible phenotypes if "A" is completely dominant over "a."
- QUESTION 26 When thinking about changes in allele frequencies over time, why do you care more about the effective population size rather than the census (total number of individuals) population size?Question 51 of 51 Click Submit to complete this assessment. Question 51 You have been doing extensive research for 30 years on the frequency of coat colors (black, gray, white) in a guinea pig population located in the Andes Mountains. You suspect that your guinea pig population is undergoing stabilizing selection. If this is the case, what would you expect to find when you graph your data? Select all that apply.A) Two peaks, one at each end of the graph.B) A graph with a single peak towards the far right.C) A graph with a single tall and narrow peak located in the center.D) A graph indicating gray guinea pigs have an advantage over black guinea pigs and white guinea pigs.E) A graph indicating that gray guinea pigs are being selected against.QUESTION 21 Which of the following can the results of a QTL tell you? a. The specific causative gene or genes underlying a trait you are studying. b. The heritability of your trait and how much the heritability is influenced by environment. c. Identify haplotypes associated with specific traits of interest in other populations. d. Identification of regions of the genome that are associated with a trait.
- QUESTION 3 Which of the following is a false statement about the Hardy-Weinberg Principle? a. It needs a large population b. No mutations or natural selection of an allele can occur c. It requires a random mating population. d. Migration is essential to maintain allelic frequencyQuestion 2. A widow's peak hairline is a dominant trait and a straight hairline is a recessive trait. What will be the genotypes and phenotypes of children of a homozygous dominant parent and a heterozygous parent? a) Construct a Punnett Square - List gametes in the area with the dashed line and the genotypes of the offspring in the area with the sold line. b) Genotypes of Children-c) Phenotypes of children-QUESTION 19 You used a QTL (locus A) to find the causal locus of a phenotype of interest (locus B). You know that there is selection on locus B in your population, but A is just a neutral marker you used in your QTL analysis. Under what conditions do you expect allele frequencies to change at locus A? a. It will change, but only when not in LD with B b. It will not change regardless of whether it is in LD with B or not c. It will change, but only when it is in LD with B d. It will change regardless of whether it is in LD with B or not
- QUESTION 8 Morphological differences are abundant among many species. We make assumptions about why adaptations exist, but to understand whether a specific trait is a adaptive and why, researchers must create experiments that have all the following, EXCEPT: a. replication of each treatment to ensure reliability of results. b. hypotheses that are testable and falsifiable. c. include control groups. d. exceedingly small sample sizes in each treatment group. e. experimental design that enables all full interpretation of differences.Question 5 A rather large population of organisms have 396 red-sided individuals and 557 tan-sided individuals. Assume that red is totally recessive. Please calculate the following: a) The allele frequencies of each allele b) The expected genotype frequencies. c) The number of heterozygous individuals that you would predict to be in this population. d) The expected phenotype frequencies. e) Conditions happen to be really good this year for breeding and next year there are 1,245 offspring. Assuming that all of the Hardy-Weinberg conditions are met, how many of these would you expect to be red-sided and how many tan-sided?QUESTION 8 In a certain population of rabbits, 25 new rabbits are born and five move into the population from surrounding areas during a single year. However, 10 rabbits die, and five leave the population during the same time frame. What is the population change for that year? a. 30 b. No change c. 15 d. 25 e. 10