Which of the following best describes why this graph could be misleading?

Chapter5: Decimals
Section5.5: Averages And Probability
Problem 400E: The cash register receipts each day last week at a coffee shop were $1,845. $1,520. $1,438, $1,682,...

Related questions

Question
Which of the following best describes why this graph could be misleading?
|
The data comes from too small of a sample. |
||
|
The source of the data is very questionable. |
||
|
A bar chart is not an appropriate graph for this data. They should have made a pie chart. |
||
|
The graph has an alternative explanation flaw in logical reasoning. |
||
|
The vertical axis (y-axis) does not start at zero. |
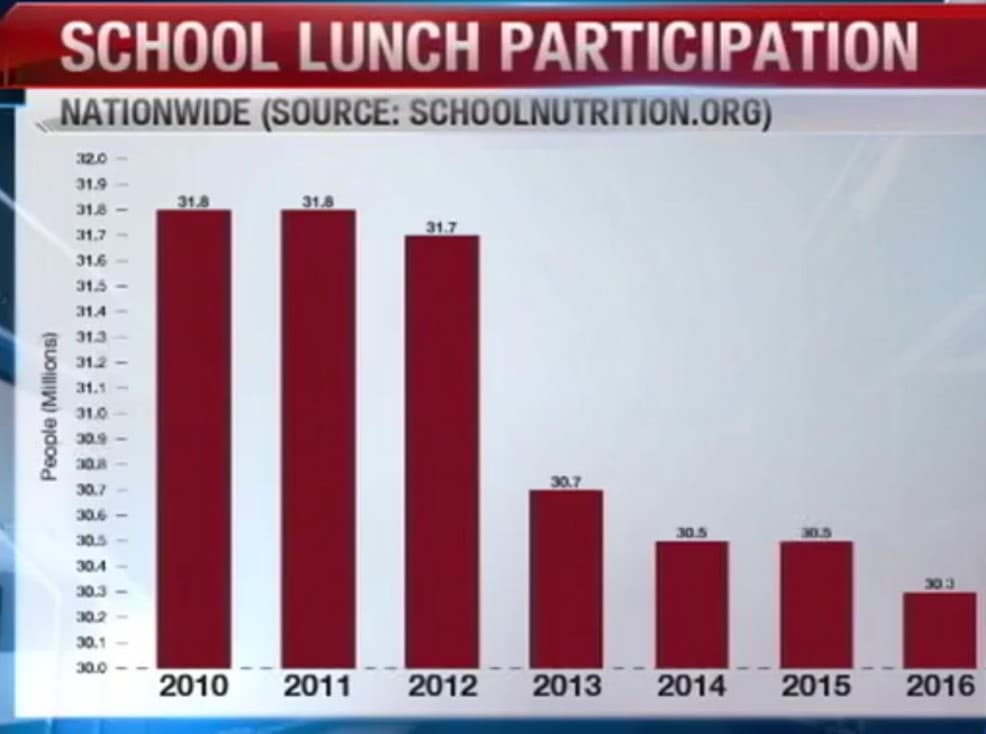
Transcribed Image Text:SCHOOL LUNCH PARTICIPATION
NATIONWIDE (SOURCE: SCHOOLNUTRITION.ORG)
320
31.9
31.8-
31.8
31.8
31.7
31.7
31.6
31.5
31.4
31.3
31.2
31.1
31.0
30.9
30J8
30.7
30.7
30.6
30.5
30.5
30.4
303
30.3-
30.2
30.1
30.0
2010
2011
2012
2013
2014
2015
2016
People (Millions)
Expert Solution
This question has been solved!
Explore an expertly crafted, step-by-step solution for a thorough understanding of key concepts.

This is a popular solution!

Trending now
This is a popular solution!

Step by step
Solved in 2 steps

Knowledge Booster


Learn more about
Need a deep-dive on the concept behind this application? Look no further. Learn more about this topic, probability and related others by exploring similar questions and additional content below.Recommended textbooks for you