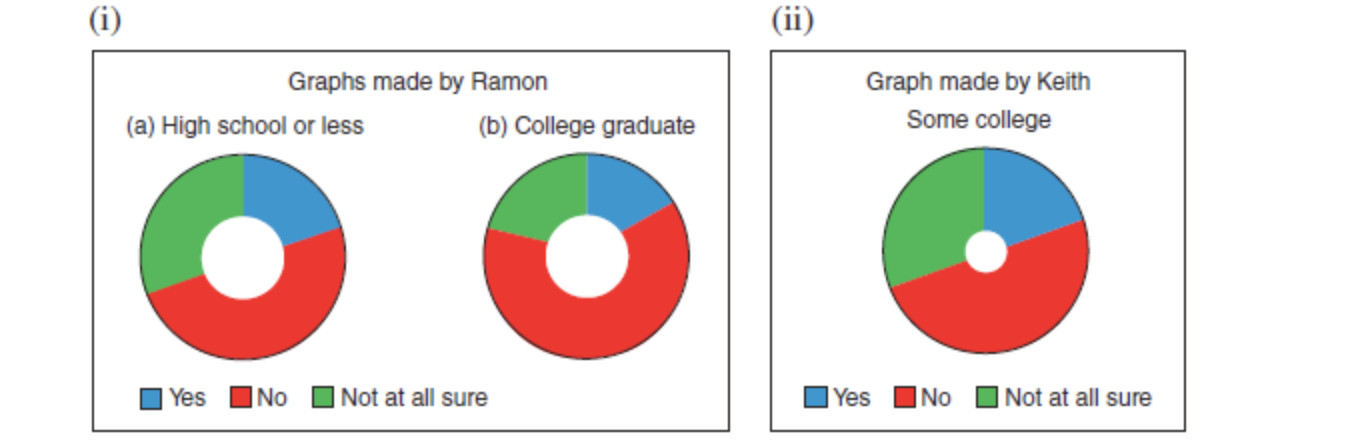
(ii) Graphs made by Ramon Graph made by Keith Some college (a) High school or less (b) College graduate Not at all sure Not at all sure Yes |No Yes |No


The book The Wall Street Journal. Guide to Information Graphics by Dona M. Wong gives strategies for using graphs and charts to display information effectively. One popular graph discussed is the donut pie chart. The donut pie chart is simply a pie chart with the center removed. A recent Harris Poll asked adults about their opinions regarding whether books should be banned from libraries because of social, language, violent, sexual, or religious content. The responses by education level to the question "Do you think that there are any books which should be banned completely?" are shown in the following donut pie charts.
(a) What feature of Keith's graph makes it difficult to visually compare the responses of those with some college to those shown in the other graphs? (Select all that apply.)
How would you change Keith's graph for easier comparison? (Select all that apply.)
(b) Compare graphs made by Ramon. At which of the two education levels is the "no" response more frequent?
Some college


Trending now
This is a popular solution!

Step by step
Solved in 2 steps


