
An Introduction to Physical Science
14th Edition
ISBN:9781305079137
Author:James Shipman, Jerry D. Wilson, Charles A. Higgins, Omar Torres
Publisher:James Shipman, Jerry D. Wilson, Charles A. Higgins, Omar Torres
Chapter5: Temperature And Heat
Section: Chapter Questions
Problem 18SA: Give descriptions of a solid, a liquid, and a gas in terms of shape and volume.

Related questions
Question
Which of the following graphics demonstrated thermal equilibrium?
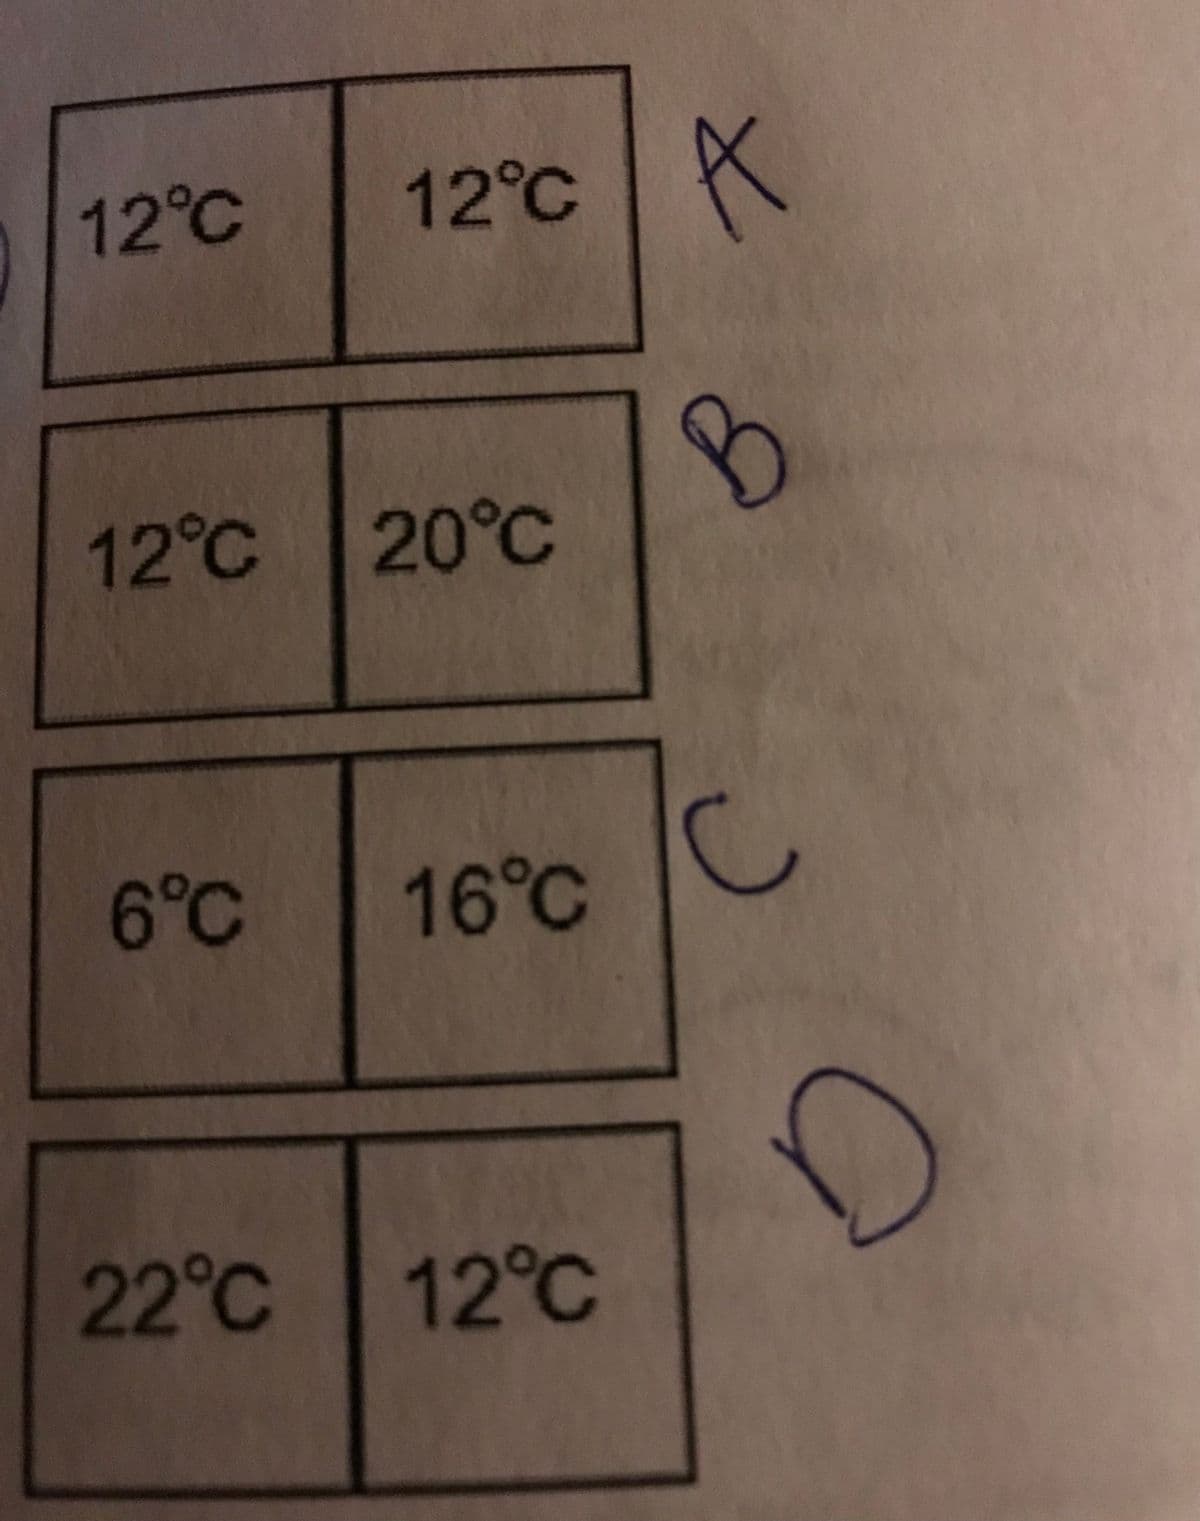
Transcribed Image Text:12°C
12°C
12°C 20°C
B
6°C
16°C
22°C 12°C
Expert Solution
This question has been solved!
Explore an expertly crafted, step-by-step solution for a thorough understanding of key concepts.

Step by step
Solved in 2 steps

Knowledge Booster


Learn more about
Need a deep-dive on the concept behind this application? Look no further. Learn more about this topic, physics and related others by exploring similar questions and additional content below.Recommended textbooks for you
An Introduction to Physical Science
Physics
ISBN:
9781305079137
Author:
James Shipman, Jerry D. Wilson, Charles A. Higgins, Omar Torres
Publisher:
Cengage Learning

Physics for Scientists and Engineers, Technology …
Physics
ISBN:
9781305116399
Author:
Raymond A. Serway, John W. Jewett
Publisher:
Cengage Learning
An Introduction to Physical Science
Physics
ISBN:
9781305079137
Author:
James Shipman, Jerry D. Wilson, Charles A. Higgins, Omar Torres
Publisher:
Cengage Learning
Physics for Scientists and Engineers, Technology …
Physics
ISBN:
9781305116399
Author:
Raymond A. Serway, John W. Jewett
Publisher:
Cengage Learning