Which of the following is false when the tails of a future stock price distribution are compared with those of a lognormal distribution with the same mean and standard deviation? Group of answer choices The right tail implies a reduced likelihood of extreme market movements compared with the log normal. The right tail is thinner
Which of the following is false when the tails of a future stock price distribution are compared with those of a lognormal distribution with the same mean and standard deviation? Group of answer choices The right tail implies a reduced likelihood of extreme market movements compared with the log normal. The right tail is thinner

Financial Management: Theory & Practice
16th Edition
ISBN:9781337909730
Author:Brigham
Publisher:Brigham
Chapter25: Portfolio Theory And Asset Pricing Models
Section: Chapter Questions
Problem 9MC

Related questions
Question
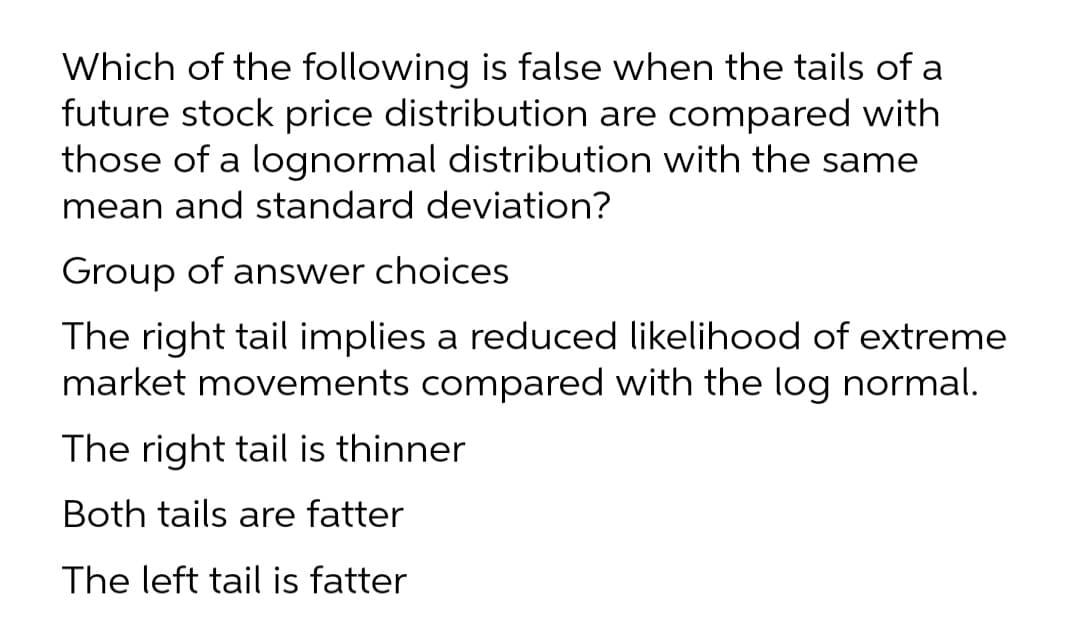
Transcribed Image Text:Which of the following is false when the tails of a
future stock price distribution are compared with
those of a lognormal distribution with the same
mean and standard deviation?
Group of answer choices
The right tail implies a reduced likelihood of extreme
market movements compared with the log normal.
The right tail is thinner
Both tails are fatter
The left tail is fatter
Expert Solution
This question has been solved!
Explore an expertly crafted, step-by-step solution for a thorough understanding of key concepts.

This is a popular solution!

Trending now
This is a popular solution!

Step by step
Solved in 2 steps

Knowledge Booster


Learn more about
Need a deep-dive on the concept behind this application? Look no further. Learn more about this topic, finance and related others by exploring similar questions and additional content below.Recommended textbooks for you

Intermediate Financial Management (MindTap Course…
Finance
ISBN:
9781337395083
Author:
Eugene F. Brigham, Phillip R. Daves
Publisher:
Cengage Learning

EBK CONTEMPORARY FINANCIAL MANAGEMENT
Finance
ISBN:
9781337514835
Author:
MOYER
Publisher:
CENGAGE LEARNING - CONSIGNMENT
Intermediate Financial Management (MindTap Course…
Finance
ISBN:
9781337395083
Author:
Eugene F. Brigham, Phillip R. Daves
Publisher:
Cengage Learning
EBK CONTEMPORARY FINANCIAL MANAGEMENT
Finance
ISBN:
9781337514835
Author:
MOYER
Publisher:
CENGAGE LEARNING - CONSIGNMENT