Which of the following samples will produce the largest value for a t statistic? Solect one: a. D = 10 with SS = 40 b. D= 5 with SS = 20 O c. D= 10 with SS = 20 d. D = 5 with SS = 40
Which of the following samples will produce the largest value for a t statistic? Solect one: a. D = 10 with SS = 40 b. D= 5 with SS = 20 O c. D= 10 with SS = 20 d. D = 5 with SS = 40

Glencoe Algebra 1, Student Edition, 9780079039897, 0079039898, 2018
18th Edition
ISBN:9780079039897
Author:Carter
Publisher:Carter
Chapter10: Statistics
Section10.5: Comparing Sets Of Data
Problem 14PPS

Related questions
Question
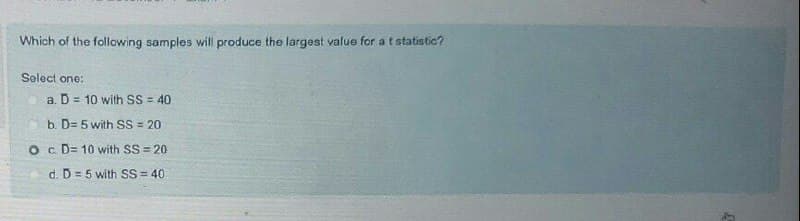
Transcribed Image Text:Which of the following samples will produce the largest value for a t statistic?
Solect one:
a. D = 10 with SS 40
b. D= 5 with SS = 20
O c. D= 10 with SS = 20
d. D = 5 with SS = 40
Expert Solution
This question has been solved!
Explore an expertly crafted, step-by-step solution for a thorough understanding of key concepts.

Step by step
Solved in 2 steps with 1 images

Recommended textbooks for you
Glencoe Algebra 1, Student Edition, 9780079039897…
Algebra
ISBN:
9780079039897
Author:
Carter
Publisher:
McGraw Hill
Glencoe Algebra 1, Student Edition, 9780079039897…
Algebra
ISBN:
9780079039897
Author:
Carter
Publisher:
McGraw Hill