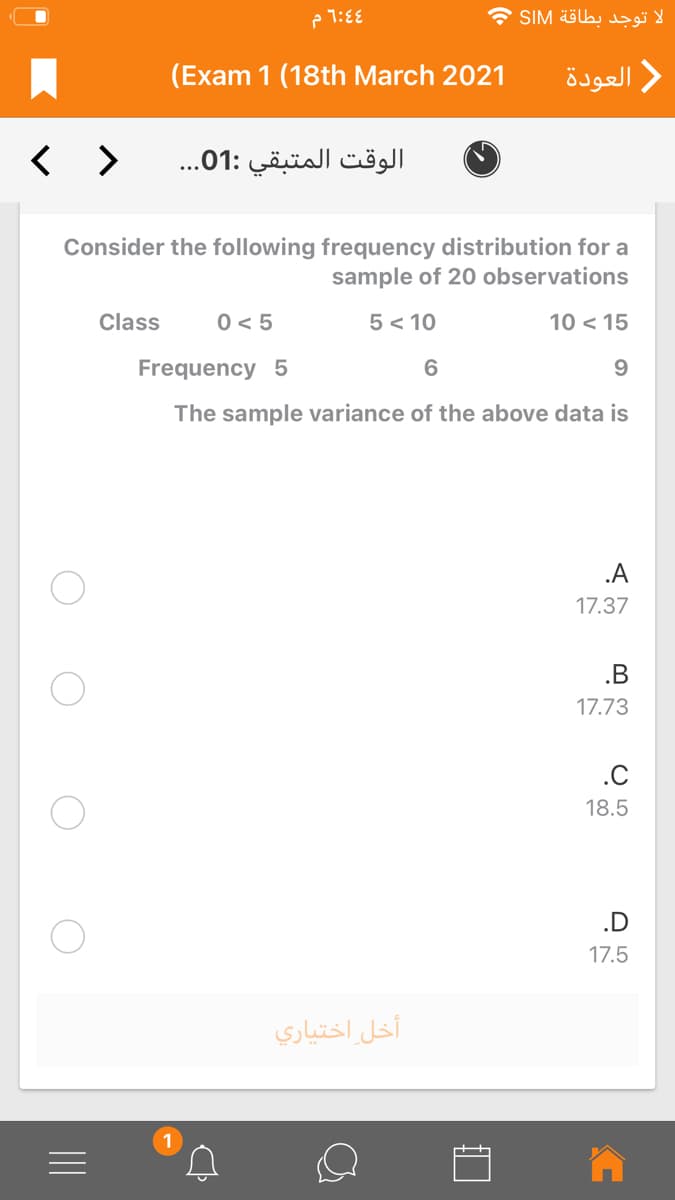
Consider the following frequency distribution for a sample of 20 observations Class 0 < 5 5 < 10 10 < 15 Frequency 5 9. The sample variance of the above data is


Q: Consider the following set of samples obtained from two normally distributed populations whose…
A: Independent events are those events whose occurrence is not dependent on any other event. If the…
Q: The following set of data is from a sample ofn=7. 8 7 4 9 1 7 13 D a. Compute the mean, median, and…
A: Since you have posted a question with multiple sub-parts, we will solve first three sub- parts for…
Q: The Metro Manila Development Authority (MMDA) is investigating the number of reported road accidents…
A: Formula : Mean = Σx*P(x) Variance = Σ(x-u)2P(x)
Q: The following sample was obtained from the population. 13,7,6,12,0,4 b) Compute the sample…
A:
Q: a) and (b) below. Use a 0.01 significance level for are from populations with the same mean. heses?
A: Let X1 be the random variable such that x̅1: Sample mean of s1: Sample standard deviation of n1:…
Q: Compute the STS (to two decimals) for a comparison of two population standard deviations or…
A: A) given S1=17.5 , S2=12.4 B) S1^2=17.5 ? S2^2=12.4
Q: For the samples summarized below, test the hypothesis, at a=.05 , that the two variances are…
A: Consider that σ1 and σ2 are the population standard deviations for populations 1 and 2,…
Q: Following is the data related to the daily production of the two factories of same product located…
A: Given data related to the daily production of the two factories of same product located in two…
Q: 1. The following summary data was obtained for a study on fabric strength of two types of wool.…
A: Note- As per our policy we can answer only 1st question. If you want solutions for other, then you…
Q: Following is the data related to the daily production of the two factories of same product located…
A: Since you have posted a question with multiple sub-parts, we will solve first three sub-parts for…
Q: For an independent samples t-test what is the degrees of freedom?
A:
Q: The following are the random sample weights of 6 babies at Philippine General Hospital. 5.0 Ibs 6.6…
A: given data 5, 6.6, 4.6, 5.2, 5.4, 5.6 n= 6
Q: Two plots at Rothamsted Experimental Station were studied for production of wheat straw. For a…
A: the sample variance is s2 not equal to 0.349. =0.458 the sample variance for this plot is s2 ≈…
Q: Consider the following data obtained for two samples selected at random from two populations that…
A: Given: Sample I Sample II32 2726 3531 3320 4027…
Q: the assumption that the t test for independent samples makes regarding the amount of variability in…
A: Independent Two Samples t-test:Suppose there are two populations independent of one another. A…
Q: 1. Consider the following random sample of data: 0sos8 O18050 outlier is removed, what is the…
A: Outliers in a data set refer to those observations that are significantly different from other…
Q: A random sample of size twenty of a golfer's scores for nine-hole rounds of golf over the past year…
A: a)Here, x x-x (x-x)2 39 -2 4 40 -1 1 40 -1 1 41 0 0 39 -2 4 40 -1 1 44 3 9 43 2 4…
Q: The following data relate to the ages at death of a certain species of rat 1 of 3 types of diets.…
A: Given, Applying ANOVA test for a single factor, i) Null and alternative hypothesis: Ho: the mean…
Q: With standard deviations of s1 = 8.88 and s2 = 30.22, and sample sizes of n1 = 7 and n2 = 8, find…
A:
Q: You have been assigned to test the hypothesis that the average number of hours per week that an…
A:
Q: Construct a frequency distribution table for the given scores of 30 students from a Mechanics of…
A: For the given data Find Mean =? median =? mode =?
Q: 2. Calculate the variance and standard deviation for the following data set: Xi: 3.0 3.5 5.0 5.5 4.0…
A: Solution-: Given data: xi fi 3 6 3.5 14 4 12 4.5 9 5 7 5.5 2 We calculate mean…
Q: Two plots at Rothamsted Experimental Station were studied for production of wheat straw. For a…
A: Given that, The annual wheat straw production from one plot 5.98 6.61 6.82 6.61 7.31 7.18 7.06 5.79…
Q: Consider the following data on marks obtained in Quizzes 1 and 2 by a sample of 10 students enrolled…
A: Given
Q: Consider the following random sample from a normal population:12 16 8 10 9a. Find the 90%…
A: The confidence interval is the interval in which the population parameter is likely to fall. The…
Q: Given the population 1,3,4,6, and 8. Suppose samples of size 3 are drawn from this population. 1.…
A: Population mean is the average of the dataset which is computed by dividing the sum of observations…
Q: Given a non-normal population with a variance of 49 and mean of 3. If the size of a sample is n =…
A: We have given that Variance =49 , mean= 3 Sample size = 81 Then standard deviation = sqrt(…
Q: Following is the data related to the daily production of the two factories of same product located…
A: Since you have posted a question with multiple sub-parts, we will solve first three sub-parts for…
Q: Consider the following sets of replicate samples 0.0902, 0.0980, 0.0956, 0.1000, 0.0925 Calculate…
A: Note: Hi there! Thank you for posting the question. As there are multiple sub parts, according to or…
Q: Q2) For the data in the following table find: 1. Variance 2. Standard deviation 3. Standard score…
A:
Q: : The frequency distribution for the values of resistance in ohms of 48 resistors is as shown. Find…
A: Class Frequency (f) Mid value (x) f⋅x f⋅x2=(f⋅x)×(x) 20.5-20.9 3 20.7 62.1 1285.47 21-21.4 10…
Q: : The frequency distribution for the values of resistance in ohms of 48 resistors is as shown. Find…
A: Given data is Class Frequency 20.5-20.9 3 21.0-21.4 10 21.5-21.9 11 22.0-22.4 13…
Q: Indicate the mean and the standard deviation of the distribution of means for each of the following…
A: We have to find mean and the standard deviation of the distribution of means for given situations.So…
Q: Calculate the variance and standard deviation for the following data set: x1: 0.5 1.0 1.5 2.0 2.5…
A: For the data set X1: 0.5 1.0 1.5 2.0 2.5 3.0, Empirical Rule: Any observation outside the interval…
Q: The following information was obtained from two independent samples selected from two normally…
A: Null Hypothesis: A hypothesis which is tested for plausible rejection is called the Null Hypothesis…
Q: Following is the data related to the daily production of the two factories of same product located…
A: Since you have posted a question with multiple sub-parts, we will solve first three sub-parts for…
Q: Two plots at Rothamsted Experimental Station were studied for production of wheat straw. For a…
A: s12=0.973 ; s22=0.329 n1= 8 , n2 = 11
Q: Following is the data related to the daily production of the two factories of same product located…
A:
Q: Consider the following results for two samples randomly taken from two populations. Sample A Sample…
A:
Q: The following data represents the discharge of an irrigation channel during a specific time.…
A: Given information: The data represents the continuous frequency distribution of time versus…
Q: The following information was obtained from independent random samples. Assume Normally distributed…
A:
Q: Consider the following data on marks obtained in Quizzes 1 and 2 by a sample of 10 students enrolled…
A: “Since you have posted a question with multiple sub-parts, we will solve first three subparts for…
Q: Example 11. Acollar manufacturer is considering the production of a new type of collar to attract…
A:
Q: The following is the frequency distribution for the speeds of a sample of automobiles traveling on…
A: From the given information, let x be the speed of automobile travelling on an interstate highway.…
Q: A systematic sample of 100 pages was taken from a Concise Oxford Dictionary and the observed…
A: The probability mass function (PMF) of the Poisson distribution for a random variable X is: Here, λ…
Q: For the following data 14 4 20 ..... Compute the Mean Compute the Variance Compute Standard…
A: Solution-: We have following data:…
Q: The following data are from a study comparing three groups of college students. The information…
A: Given data
Q: You are asked to calculate the 94% Cl for the mean value of a normally distributed population with…
A:
Q: For the following sample of scores that represent a continuous variable, calculate the range and…
A: Let the scores be denoted by 'x' The scores are : x1=7x2=9x3=1x4=3 The mean score is…

Step by step
Solved in 2 steps


- Generate two set of data of at least with ten data points using any scenario of your choice,Using the six steps of hypothesis test if there is difference in the mean and the proportion?2. Generate at least three set of data at least with ten data points using any scenario of your choice. Test if there is difference in their variancesMake conclusions about the population mean based on the test-statisticvalue and rejection region when the population variance is assumed to beunknown.A correlation coefficient is computed from a sample of data values selected from a population is called a statistic and is subject to sampling error. True or False.
- A new fuel injection system has been engineered for pickup trucks. The new system and the old system both produce about the same average miles per gallon. However, engineers question which system (old or new) will give better consistency in fuel consumption (miles per gallon) under a variety of driving conditions. A random sample of 41 trucks were fitted with the new fuel injection system and driven under different conditions. For these trucks, the sample variance of gasoline consumption was 54.2. Another random sample of 23 trucks were fitted with the old fuel injection system and driven under a variety of different conditions. For these trucks, the sample variance of gasoline consumption was 34.6. Test the claim that there is a difference in population variance of gasoline consumption for the two injection systems. Use a 5% level of significance. How could your test conclusion relate to the question regarding the consistency of fuel consumption for the two fuel injection systems? A)…Traffic accidents occur frequently on the 100 km long E-5 highway connecting Konya and Karaman: Although expert teams affiliated to the General Directorate of Highways (KGM) say that the accidents on the E-5 are randomly (unevenly) distributed, the news media state the opposite. KGM has published the locations of 20 accidents resulting in death or injury in the past 12 months, showing the distances from Konya as follows: Use the Kolmogorov-Smirnov test to test whether the distribution of locations of accidents that occurred in the last 12 months is evenly distributed.Chicken farming is a multi-billion dollar industry, and any methods that increase the growth rate of young chicks can reduce consumer costs while increasing company profits, possibly by millions of dollars. An experiment was conducted to measure and compare the effectiveness of various feed supplements on the growth rate of chickens. Newly hatched chicks were randomly allocated into six groups, and each group was given a different feed supplement. Below are some summary statistics from this data set showing the distribution of weights by feed type. Mean SD Sample Size casein 323.58 64.43 12 horsebean 160.20 38.63 10 linseed 218.75 52.24 12 meatmeal 276.91 64.90 11 soybean 246.43 54.13 14 sunflower 328.92 48.84 12 (a) Do these data provide strong evidence that the average weights of chickens that were fed lineseed and horsebean are different? Use a 5% significance level.Hint: We are interested in the difference: lineseed-horsebean Test Statistic: _______…
- For part 1 of your assignment, you’ll need to download the Excel data file, and conduct the appropriate hypothesis test to determine whether the average returns in each industry differ (use a 5% significance level, and assume that population variances are not equal.) The results of your testing need to be shown in the space provided in the file. This will be submitted to Canvas through the assignment link. For part 2 of the assignment, your new boss has required you to submit a report the provides the descriptive statistics for each industry, as well as comments on the reward and risk for investing in each. You will also analyze the results of your statistical test and summarize the conclusion in the context of the problem. What are your final recommendations and why? This should be written as if you were writing a professional report to your employer, not an outline of tasks you did for a project in stat class. Let your instructor know if you are not sure of this difference. You can…A social psychologist wants to know if people judge a person's attractiveness differently if they appear rich or poor. Two pictures were taken with the same model, one in expensive clothes standing next to a new sports car, and the other in old clothes standing next to an old hatchback car. In an online survey, participants were randomly divided so that they saw one of the two pictures and were asked to rate the model's attractiveness on a scale of 1 to 10. Which statistical test would be best to determine if there is a significant difference between groups? one-sample t-test dependent samples t-test independent samples t-test ANOVAA new fuel injection system has been engineered for pickup trucks. The new system and the old system both produce about the same average miles per gallon. However, engineers question which system (old or new) will give better consistency in fuel consumption (miles per gallon) under a variety of driving conditions. A random sample of 31 trucks were fitted with the new fuel injection system and driven under different conditions. For these trucks, the sample variance of gasoline consumption was 52.1. Another random sample of 21 trucks were fitted with the old fuel injection system and driven under a variety of different conditions. For these trucks, the sample variance of gasoline consumption was 31.6. Test the claim that there is a difference in population variance of gasoline consumption for the two injection systems. Use a 5% level of significance. How could your test conclusion relate to the question regarding the consistency of fuel consumption for the two fuel injection systems? (a)…
- 1. Should there be a significant difference with this study, what post-hoc test shall be used? A researcher wanted to investigate into the Level of Agreement of people to Same Sex Union. 10 members each of four groups were asked to indicate their agreement to the issue. The four groups are: the Catholic Church, the Lesbian, Gay Bisexual, Transgendered (LGBT) Community, Lawmakers, as well as individuals in the Academe. a. t-Test paired two sample for means b. t-Test assuming equal variances c. t-Test assuming unequal variances 2. Which MS Excel Tool shall be used with this problem? Dr. Hess has done work that suggests that emotional arousal affects pupil size. To ascertain if the type of arousal makes a difference, you decided to measure pupil size under three different arousal conditions (Neutral, Pleasant, Aversive). Each participant will look at all the different pictures that differ according to the condition. The pupil size after viewing each…A researcher is trying find out which of the 3 Vaccine types and age groups has the highest immune response via antibody titer. You assign different municipalities to a combination of age groups (i.e., 18-30, 31-50, 51-75 y.o.) and Vaccine type (i.e., Vaccine 1, 2, 3) and took the antibody titer measurements of the participants after 2 weeks of vaccine inoculation. Given this scenario, what particular statistical tool will you use to know if vaccine type and age group have an effect on average antibody titer? Why? Explain thoroughly.The effects of two catalysts on the mean yield of a chemical process are being investigated.A test is conducted in the pilot plant, yielding the data reported in Table 1. Is there anydifference between the mean yields from the two catalyst at the 5% significance level?Assume the two population variances are equal.


