Which of the following statements about functional response curves is FALSE? Under Type 3 curves, food intake increase slowly at the lowest prey densities O Type 2 curves can arise when there is substantial handling time involved in capturing and eating prey. Type 1 curves are the most common found in nature. For all functional response curves, food intake becomes limited by internal factors at high prey densities.
Which of the following statements about functional response curves is FALSE? Under Type 3 curves, food intake increase slowly at the lowest prey densities O Type 2 curves can arise when there is substantial handling time involved in capturing and eating prey. Type 1 curves are the most common found in nature. For all functional response curves, food intake becomes limited by internal factors at high prey densities.

Biology: The Dynamic Science (MindTap Course List)
4th Edition
ISBN:9781305389892
Author:Peter J. Russell, Paul E. Hertz, Beverly McMillan
Publisher:Peter J. Russell, Paul E. Hertz, Beverly McMillan
Chapter53: Population Interactions And Community Ecology
Section: Chapter Questions
Problem 1TYK

Related questions
Question
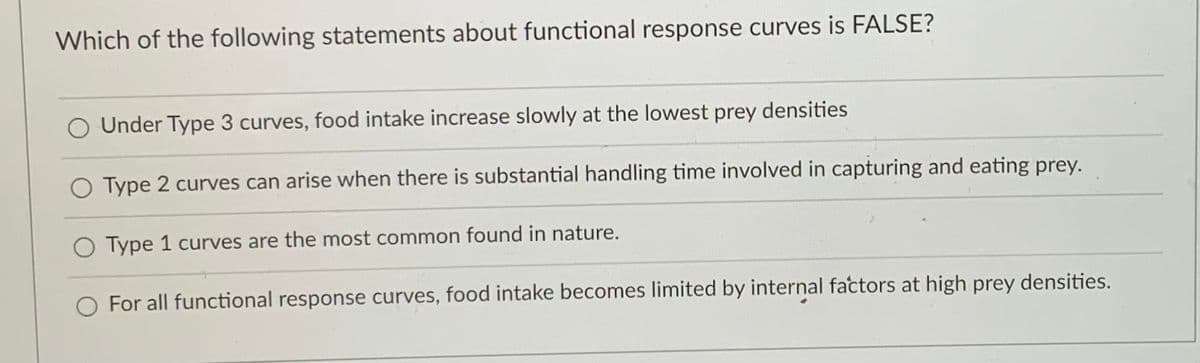
Transcribed Image Text:Which of the following statements about functional response curves is FALSE?
O Under Type 3 curves, food intake increase slowly at the lowest prey densities
O Type 2 curves can arise when there is substantial handling time involved in capturing and eating prey.
O Type 1 curves are the most common found in nature.
O For all functional response curves, food intake becomes limited by internal factors at high prey densities.
Expert Solution
Step 1
- The number of prey successfully attacked by a predator as a function of prey density is referred to as the functional response .
- It explains how a predator reacts to changes in prey density.
- At large prey densities, internal constraints limit food intake for all functional response curves.
divided functional responses into three categories :
Type 1 curve
- A predator's rate of prey consumption increases linearly with prey density until it reaches a maximum threshold, at which point it plateaus.
- This kind of functional response isn't seen very often.
- It would happen if the handling time was so short that a predator could keep up with rising prey density while always being ready to consume the next prey item as soon as it was discovered.
Type 2 curve
- The proportion of prey devoured drops monotonically with prey density in type II.
- When there is a lot of handling time involved in catching and eating animals, type 2 curves can appear.
Type 3 curve
- A sigmoid relationship describes Type III, in which the proportion of prey consumed is positively density-dependent in some prey density zones.
- At the lowest prey densities, food consumption increases slowly under type 3 curves.

Trending now
This is a popular solution!

Step by step
Solved in 2 steps

Knowledge Booster


Learn more about
Need a deep-dive on the concept behind this application? Look no further. Learn more about this topic, biology and related others by exploring similar questions and additional content below.Recommended textbooks for you
Biology: The Dynamic Science (MindTap Course List)
Biology
ISBN:
9781305389892
Author:
Peter J. Russell, Paul E. Hertz, Beverly McMillan
Publisher:
Cengage Learning

Biology: The Dynamic Science (MindTap Course List)
Biology
ISBN:
9781305389892
Author:
Peter J. Russell, Paul E. Hertz, Beverly McMillan
Publisher:
Cengage Learning