Which of the following statements are true according to the previous graph? Check all that apply. O The marginal-cost curve is below the average-total-cost curve when output is greater than four and average total cost is rising. The marginal-cost curve is above the average-total-cost curve when output is greater than four and average total cost is rising. O The marginal-cost curve lies below the average-variable-cost curve.
Which of the following statements are true according to the previous graph? Check all that apply. O The marginal-cost curve is below the average-total-cost curve when output is greater than four and average total cost is rising. The marginal-cost curve is above the average-total-cost curve when output is greater than four and average total cost is rising. O The marginal-cost curve lies below the average-variable-cost curve.

Principles of Economics, 7th Edition (MindTap Course List)
7th Edition
ISBN:9781285165875
Author:N. Gregory Mankiw
Publisher:N. Gregory Mankiw
Chapter13: The Cost Of Production
Section: Chapter Questions
Problem 9PA

Related questions
Question
.......
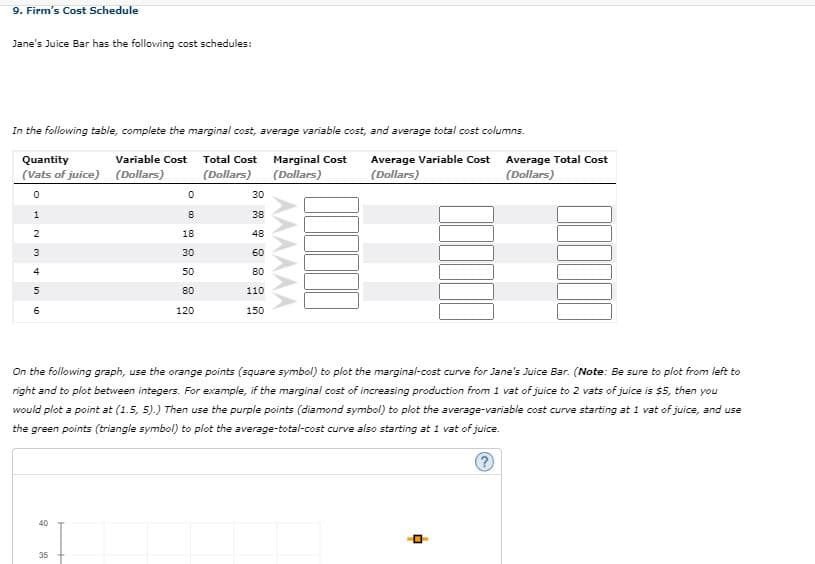
Transcribed Image Text:9. Firm's Cost Schedule
Jane's Juice Bar has the following cost schedules:
In the following table, complete the marginal cost, average variable cost, and average total cost columns.
Marginal Cost
(Dollars)
Variable Cost
Total Cost
Average Total Cost
Average Variable Cost
(Dollars)
Quantity
(Vats of juice) (Dollars)
(Dollars)
(Dollars)
30
1
38
2
18
48
3
30
60
4
50
80
5
80
110
6
120
150
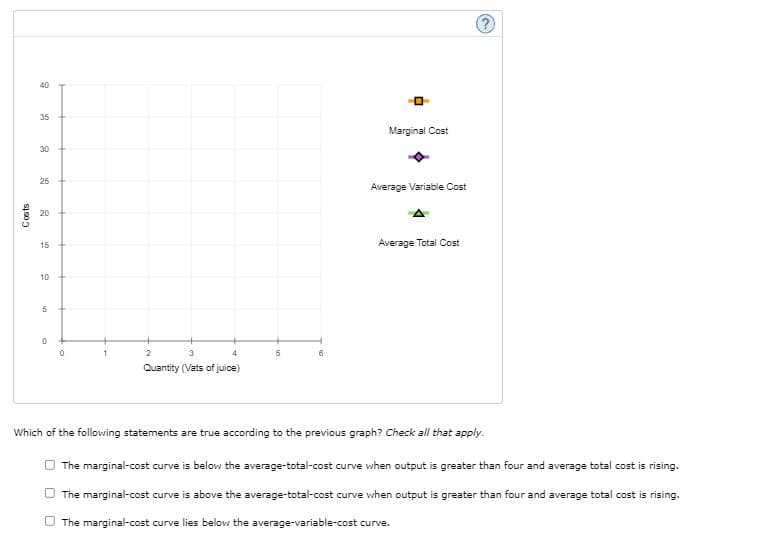
On the following graph, use the orange points (square symbol) to plot the marginal-cost curve for Jane's Juice Bar. (Note: Be sure to plot from left to
right and to plot between integers. For example, if the marginal cost of increasing production from 1 vat of juice to 2 vats of juice is $5, then you
would plot a point at (1.5, 5).) Then use the purple points (diamond symbol) to plot the average-variable cost curve starting at 1 vat of juice, and use
the green points (triangle symbol) to plot the average-total-cost curve also starting at 1 vat of juice.
40
35
AAAAAA
Transcribed Image Text:40
35
Marginal Cost
30
25
Average Variable Cost
20
15
Average Total Cost
10
5
2
Quantity (Vats of juice)
Which of the following statements are true according to the previous graph? Check all that apply.
O The marginal-cost curve is below the average-total-cost curve when output is greater than four and average total cost is rising.
O The marginal-cost curve is above the average-total-cost curve when output is greater than four and average total cost is rising.
O The marginal-cost curve lies below the average-variable-cost curve.
Costs
Expert Solution
This question has been solved!
Explore an expertly crafted, step-by-step solution for a thorough understanding of key concepts.

This is a popular solution!

Trending now
This is a popular solution!

Step by step
Solved in 2 steps with 2 images

Knowledge Booster


Learn more about
Need a deep-dive on the concept behind this application? Look no further. Learn more about this topic, economics and related others by exploring similar questions and additional content below.Recommended textbooks for you
Principles of Economics, 7th Edition (MindTap Cou…
Economics
ISBN:
9781285165875
Author:
N. Gregory Mankiw
Publisher:
Cengage Learning

Essentials of Economics (MindTap Course List)
Economics
ISBN:
9781337091992
Author:
N. Gregory Mankiw
Publisher:
Cengage Learning

Principles of Economics (MindTap Course List)
Economics
ISBN:
9781305585126
Author:
N. Gregory Mankiw
Publisher:
Cengage Learning
Principles of Economics, 7th Edition (MindTap Cou…
Economics
ISBN:
9781285165875
Author:
N. Gregory Mankiw
Publisher:
Cengage Learning
Essentials of Economics (MindTap Course List)
Economics
ISBN:
9781337091992
Author:
N. Gregory Mankiw
Publisher:
Cengage Learning
Principles of Economics (MindTap Course List)
Economics
ISBN:
9781305585126
Author:
N. Gregory Mankiw
Publisher:
Cengage Learning

Principles of Microeconomics (MindTap Course List)
Economics
ISBN:
9781305971493
Author:
N. Gregory Mankiw
Publisher:
Cengage Learning

Principles of Economics 2e
Economics
ISBN:
9781947172364
Author:
Steven A. Greenlaw; David Shapiro
Publisher:
OpenStax
