Which of the following would be the standard deviation used in developing the p-control chart?
Which of the following would be the standard deviation used in developing the p-control chart?

A First Course in Probability (10th Edition)
10th Edition
ISBN:9780134753119
Author:Sheldon Ross
Publisher:Sheldon Ross
Chapter1: Combinatorial Analysis
Section: Chapter Questions
Problem 1.1P: a. How many different 7-place license plates are possible if the first 2 places are for letters and...

Related questions
Question
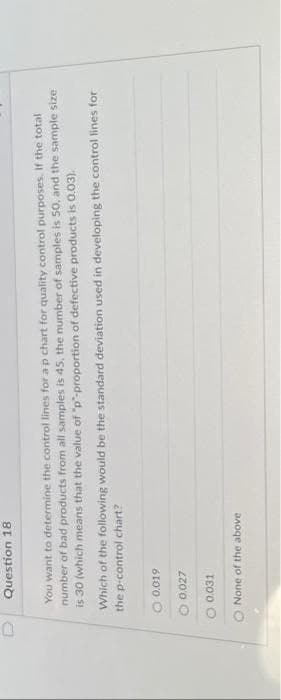
Transcribed Image Text:Question 18
You want to determine the control lines for a p chart for quality control purposes. If the total
number of bad products from all samples is 45, the number of samples is 50, and the sample size
is 30 (which means that the value of "p"-proportion of defective products is 0.03).
Which of the following would be the standard deviation used in developing the control lines for
the p-control chart?
0.019
0.027
O 0.031
O None of the above
Expert Solution
This question has been solved!
Explore an expertly crafted, step-by-step solution for a thorough understanding of key concepts.

Step by step
Solved in 2 steps

Recommended textbooks for you
A First Course in Probability (10th Edition)
Probability
ISBN:
9780134753119
Author:
Sheldon Ross
Publisher:
PEARSON

A First Course in Probability (10th Edition)
Probability
ISBN:
9780134753119
Author:
Sheldon Ross
Publisher:
PEARSON