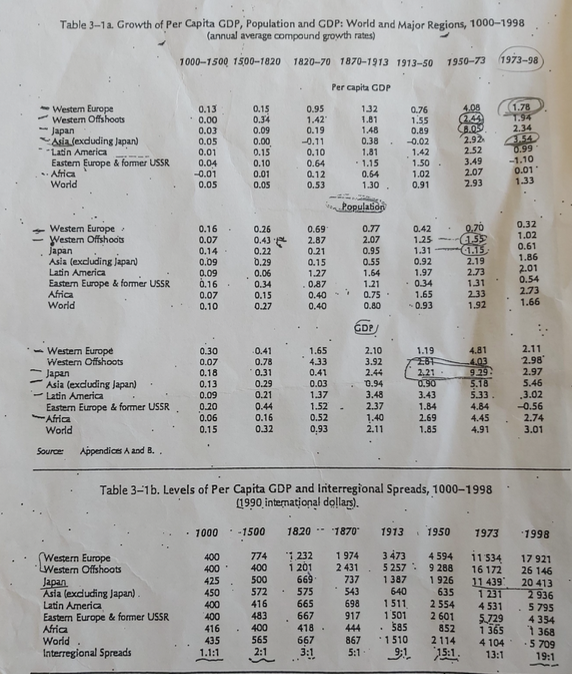
Why did the average GDP growth rate declined in Western Europe during the period of 1913- 1950 comparing to the period 1870-1913. Start you answer by quoting the GDP growth rates (not GDP per capita growth rates) from the Madison table
Why did the average GDP growth rate declined in Western Europe during the period of 1913- 1950 comparing to the period 1870-1913. Start you answer by quoting the GDP growth rates (not GDP per capita growth rates) from the Madison table

Chapter16: Economic Growth
Section: Chapter Questions
Problem 3E

Related questions
Question
Why did the average
Transcribed Image Text:Table 3-1a. Growth of Per Capita GDP, Population and GDP: World and Major Regions, 1000–1998
(annual average compound growth rates)
1000-1500 1500-1820
1820-70 1870-1913 1913-50
1950-73
(1973-98
Per capita GDP
1.78
T.94
2.34
3.54
0.99
-1.10
0.01
1.33
0.95
1.42
Westem Europe
Westem Offhoots
Japan
Asia (exduding Japan)
"Lain America
Eastem Europe & former USSR
Africa
World
0.13
• 0.00
4.08
0.15
0.34
132
1.81
0.76
1.55
0.89
8.05
2.92
2.52
1.48
0.38
1.81
• 1.15
0.64
1.30.
0.03
0.09
0.19
0.05
0.00
0.15
-0.11
-0.02
0.01
0.04
-0.01
0.05
0.10
0.64
0.12
0.53
1.42
1.50.
3.49
2.07
2.93
0.10
0.01
0.05
1.02
0.91
Populabon
0.32
1.02
0.70
(155
1.15
2.19
Westem Europe
Westem Offshoots
Japan
Asia (excluding Japan)
Latin America
Eastem Europe & former USSR
Africa
World
0.16.
0.07
0.14.
0.09
0.09
0.16.
0.26
0.43
0.22
0.29
0.06
0.69
2.87
0.21
0.15
1.27
0.77
2.07
0.95
0.55
1.64
1.21
0.75
0.42
1.25
1.31
0.61
1.86
2.01
0.54
2.73
1.66
0.92
1.97
2.73
• 0.34
1.65
- 0.93
131
2.33
1.92
0.34
.0.87
0.15
0.27
0.40
0.40
0.07
0.10
0.80
GDP/
1.65
4.33
0.41
2.11
2.98
2.97
5.46
.3.02
-0.56
2.74
3.01
2.10
Westem Europe
Western Offshoots
- Japan
Asia (excluding Japan)
- Latin America
Eastern Europe & former USSR
Africa
World
4.81
4.03
9.29.
5.18
5.33
4.84
4.45
0.30
0.07
0.18
0.41
1.19
0.78
*0.31
3.92
281
2,21 .
0.90
3.43
1.84
2.69
1.85
2.44
0.13
0.09
0.20
0.06
0.15
0.29
0.21
0.44
0.16
0.32
0.03
1.37
0.94
3,48
2.37
1.40
2.11
1.52
0.52
0,93
4.91
Source
Appendices A and B. .
Table 3-1b. Levels of Per Capita GDP and Interregional Spreads, 1000-1998
1990 international dollar).
· 1000
--1500
1820 -
1870
1913
1950
1973
1998
1 232
1 201
669
575
3 473
5 257 .
1387
640
1511
1 501
• 585
1510
1 974
2 431
737
11 534
16 172
(Western Europe
Western Offshoots
Japan
Asia (exduding Japan).
Latin America
Eastem Europe & former USSR
Africa
World
Interregional Spreads
400
400
425
450
400
400
416
435
1.1:1
774
400
500
572
416
483
400
565
2:1
4 594
9 288
1 926
635
2 554
2 601
17 921
26 146
20 413
2 936
5 795
4 354
1 368
-5 709
19:1
11 439
1 231
4 531
543
665
667
418
667
3:1
698
917
5.729
1 365
444
867
5:1
852
2114
4 104
13:1
Expert Solution
This question has been solved!
Explore an expertly crafted, step-by-step solution for a thorough understanding of key concepts.

Step by step
Solved in 3 steps

Knowledge Booster


Learn more about
Need a deep-dive on the concept behind this application? Look no further. Learn more about this topic, economics and related others by exploring similar questions and additional content below.Recommended textbooks for you


