Why type of control chart should be used? Xbar chart and R chart O chart O p chart O Sigma chart
Why type of control chart should be used? Xbar chart and R chart O chart O p chart O Sigma chart

Practical Management Science
6th Edition
ISBN:9781337406659
Author:WINSTON, Wayne L.
Publisher:WINSTON, Wayne L.
Chapter2: Introduction To Spreadsheet Modeling
Section: Chapter Questions
Problem 20P: Julie James is opening a lemonade stand. She believes the fixed cost per week of running the stand...

Related questions
Question
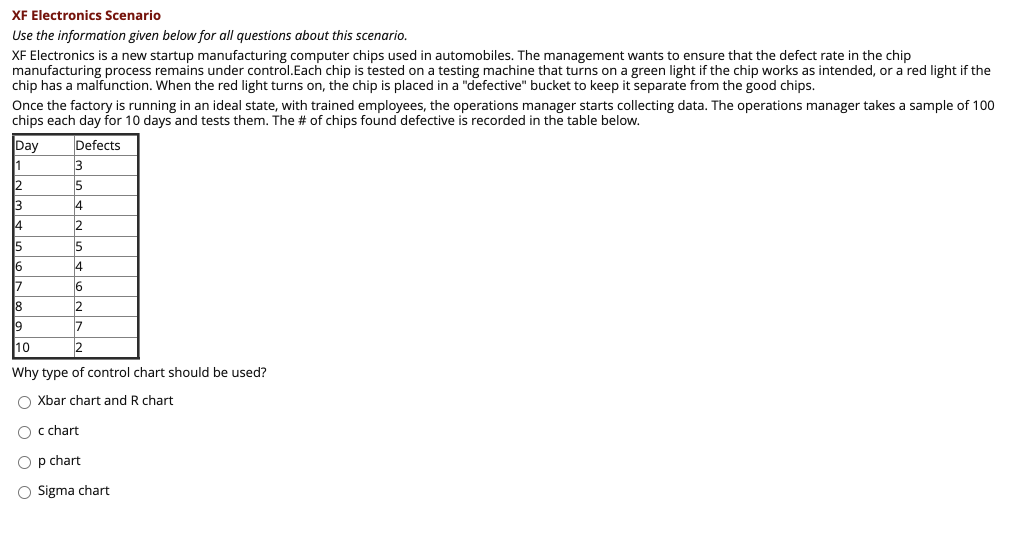
Transcribed Image Text:XF Electronics Scenario
Use the information given below for all questions about this scenario.
XF Electronics is a new startup manufacturing computer chips used in automobiles. The management wants to ensure that the defect rate in the chip
manufacturing process remains under control.Each chip is tested on a testing machine that turns on a green light if the chip works as intended, or a red light if the
chip has a malfunction. When the red light turns on, the chip is placed in a "defective" bucket to keep it separate from the good chips.
Once the factory is running in an ideal state, with trained employees, the operations manager starts collecting data. The operations manager takes a sample of 100
chips each day for 10 days and tests them. The # of chips found defective is recorded in the table below.
Day
Defects
1
3
2
15
3
4
14
15
5
16
4
18
2
19
7
2
10
Why type of control chart should be used?
O Xbar chart and R chart
O c chart
O p chart
Sigma chart
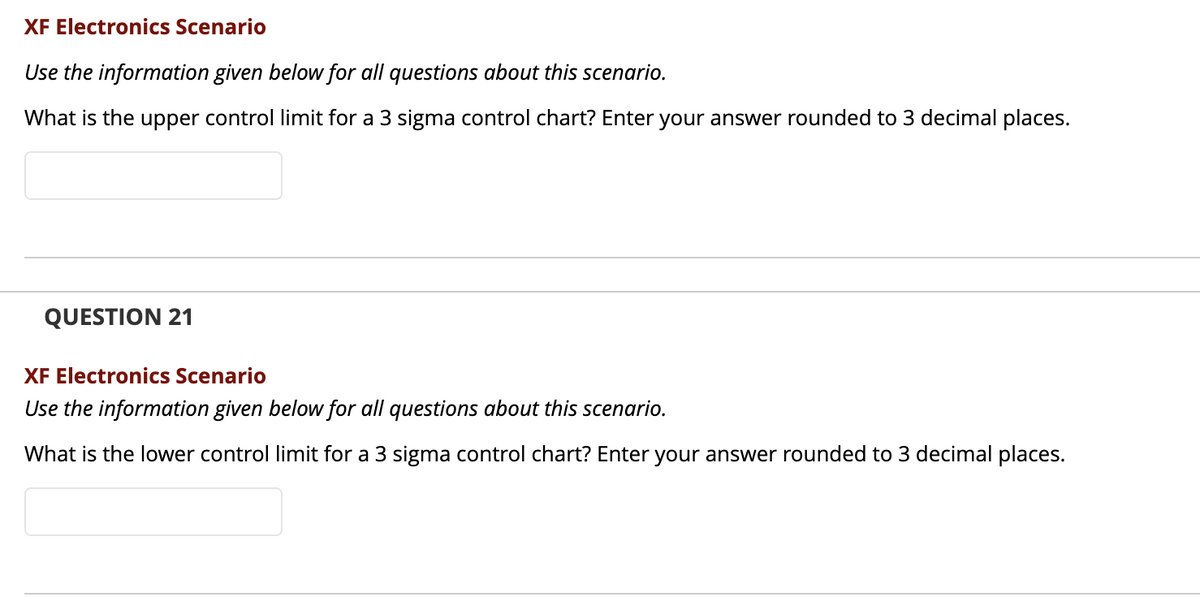
Transcribed Image Text:XF Electronics Scenario
Use the information given below for all questions about this scenario.
What is the upper control limit for a 3 sigma control chart? Enter your answer rounded to 3 decimal places.
QUESTION 21
XF Electre
cs Scenario
Use the information given below for all questions about this scenario.
What is the lower control limit for a 3 sigma control chart? Enter your answer rounded to 3 decimal places.
Expert Solution
This question has been solved!
Explore an expertly crafted, step-by-step solution for a thorough understanding of key concepts.

This is a popular solution!

Trending now
This is a popular solution!

Step by step
Solved in 2 steps with 4 images

Recommended textbooks for you
Practical Management Science
Operations Management
ISBN:
9781337406659
Author:
WINSTON, Wayne L.
Publisher:
Cengage,

Operations Management
Operations Management
ISBN:
9781259667473
Author:
William J Stevenson
Publisher:
McGraw-Hill Education

Operations and Supply Chain Management (Mcgraw-hi…
Operations Management
ISBN:
9781259666100
Author:
F. Robert Jacobs, Richard B Chase
Publisher:
McGraw-Hill Education
Practical Management Science
Operations Management
ISBN:
9781337406659
Author:
WINSTON, Wayne L.
Publisher:
Cengage,
Operations Management
Operations Management
ISBN:
9781259667473
Author:
William J Stevenson
Publisher:
McGraw-Hill Education
Operations and Supply Chain Management (Mcgraw-hi…
Operations Management
ISBN:
9781259666100
Author:
F. Robert Jacobs, Richard B Chase
Publisher:
McGraw-Hill Education


Purchasing and Supply Chain Management
Operations Management
ISBN:
9781285869681
Author:
Robert M. Monczka, Robert B. Handfield, Larry C. Giunipero, James L. Patterson
Publisher:
Cengage Learning

Production and Operations Analysis, Seventh Editi…
Operations Management
ISBN:
9781478623069
Author:
Steven Nahmias, Tava Lennon Olsen
Publisher:
Waveland Press, Inc.