Wife Alternating Husband Jointly Laundry 156 14 2 4 Main meal 124 20 4 Dinner 77 11 7 13 Breakfeast 82 36 15 7 Tidying 53 11 1 57 Dishes 32 24 4 53 Shopping 33 23 55 Official 12 46 23 15 Driving 10 51 75 3 Finances 13 13 21 66 Insurance 8 1 53 77 Repairs Holidays 3 160 2 1 153 Table 1: house-tasks dataset The data is a contingency table containing 13 house-tasks and their distribution. The rows are the different tasks and values are the frequencies of the tasks done as follows: • by the wife only • alternatively • by the husband only • or jointly Q1. Compute chi-square test in R and discuss the tasks distribution Q2. Extract the observed and the expected counts from the result of the test Q3. Visualise the results with the suitable plot/s.
Wife Alternating Husband Jointly Laundry 156 14 2 4 Main meal 124 20 4 Dinner 77 11 7 13 Breakfeast 82 36 15 7 Tidying 53 11 1 57 Dishes 32 24 4 53 Shopping 33 23 55 Official 12 46 23 15 Driving 10 51 75 3 Finances 13 13 21 66 Insurance 8 1 53 77 Repairs Holidays 3 160 2 1 153 Table 1: house-tasks dataset The data is a contingency table containing 13 house-tasks and their distribution. The rows are the different tasks and values are the frequencies of the tasks done as follows: • by the wife only • alternatively • by the husband only • or jointly Q1. Compute chi-square test in R and discuss the tasks distribution Q2. Extract the observed and the expected counts from the result of the test Q3. Visualise the results with the suitable plot/s.

Glencoe Algebra 1, Student Edition, 9780079039897, 0079039898, 2018
18th Edition
ISBN:9780079039897
Author:Carter
Publisher:Carter
Chapter10: Statistics
Section10.6: Summarizing Categorical Data
Problem 25PPS

Related questions
Question
Please answer all my questions by using R or excel
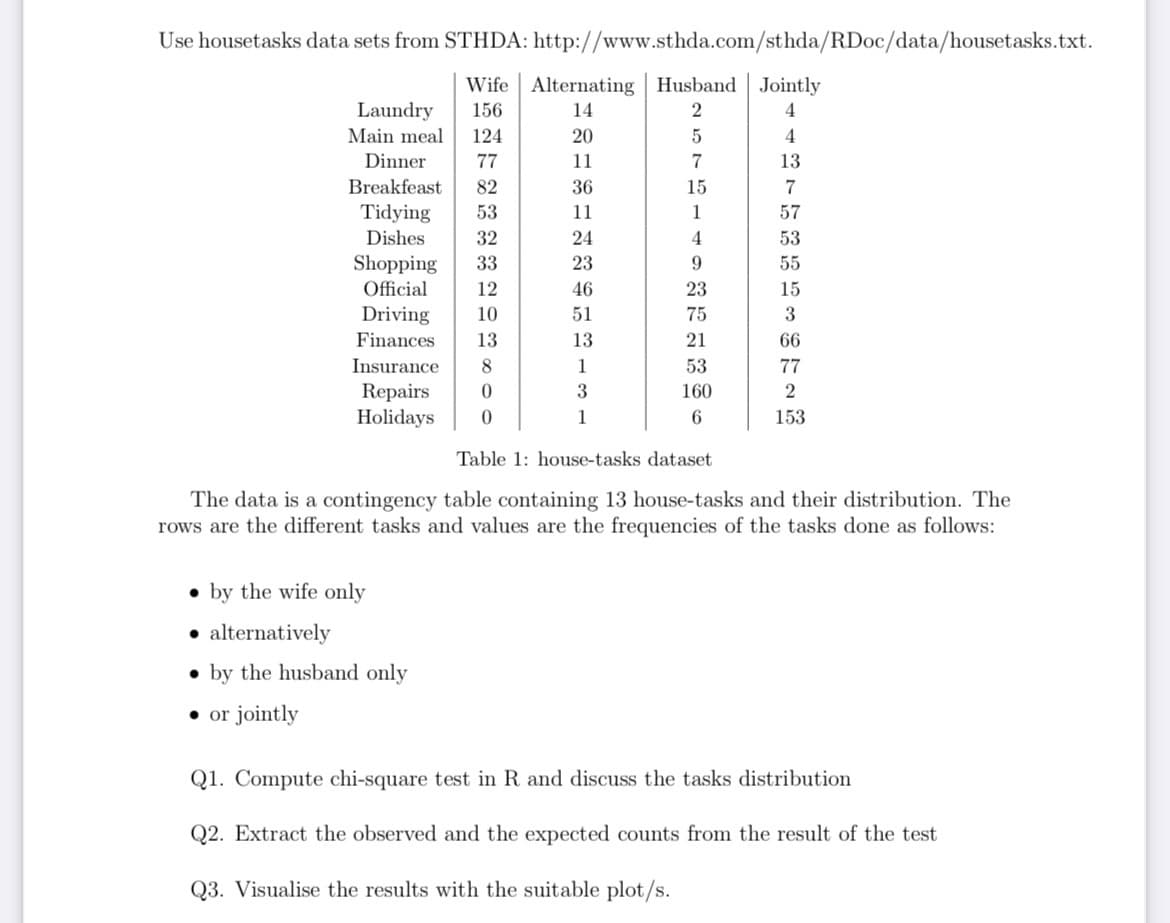
Transcribed Image Text:Use housetasks data sets from STHDA: http://www.sthda.com/sthda/RDoc/data/housetasks.txt.
Wife Alternating Husband Jointly
Laundry
Main meal
156
14
2
124
20
Dinner
77
11
7
13
Breakfeast
82
36
15
Tidying
53
11
1
Dishes
32
24
4.
53
Shopping
33
23
55
Official
12
46
23
15
Driving
10
51
75
Finances
13
13
21
66
Insurance
8
1
53
77
Repairs
Holidays
160
1
153
Table 1: house-tasks dataset
The data is a contingency table containing 13 house-tasks and their distribution. The
rows are the different tasks and values are the frequencies of the tasks done as follows:
• by the wife only
• alternatively
• by the husband only
• or jointly
Q1. Compute chi-square test in R and discuss the tasks distribution
Q2. Extract the observed and the expected counts from the result of the test
Q3. Visualise the results with the suitable plot/s.
4 B75%函旧3的T2%
Expert Solution
This question has been solved!
Explore an expertly crafted, step-by-step solution for a thorough understanding of key concepts.

Step by step
Solved in 5 steps with 5 images

Recommended textbooks for you
Glencoe Algebra 1, Student Edition, 9780079039897…
Algebra
ISBN:
9780079039897
Author:
Carter
Publisher:
McGraw Hill

Holt Mcdougal Larson Pre-algebra: Student Edition…
Algebra
ISBN:
9780547587776
Author:
HOLT MCDOUGAL
Publisher:
HOLT MCDOUGAL

Glencoe Algebra 1, Student Edition, 9780079039897…
Algebra
ISBN:
9780079039897
Author:
Carter
Publisher:
McGraw Hill
Holt Mcdougal Larson Pre-algebra: Student Edition…
Algebra
ISBN:
9780547587776
Author:
HOLT MCDOUGAL
Publisher:
HOLT MCDOUGAL