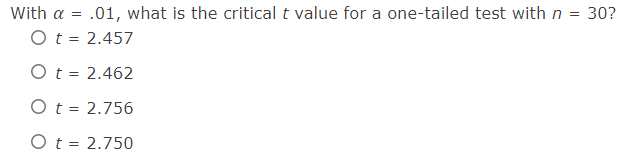
With a = .01, what is the critical t value for a one-tailed test with n = 30? O t = 2.457 Ot = 2.462 Ot = 2.756 Ot = 2.750


Q: If the calculated F-value is less than the critical F-value in a one-way ANOVA, then the correct…
A: We have given the statement about F - values
Q: Pain medications sometimes come with side effects. One side effect is dizziness. A researcher…
A: We have given data Tordol Placebo Naproxen Tylenol Advil Dizziness 83 32 36 5 8 No…
Q: Using the standard normal distribution, find the two z-scores that form the middle shaded region.…
A:
Q: You wish to test the following claim at a significance level of a = 0.02. Ho:p = 0.22 H1:p < 0.22…
A:
Q: Determine the critical value(s) for a right-tailed hypothesis test for a mean with the given…
A:
Q: A study by a certain county is trying to find out what percentage of sidewalks are in need of…
A: The 98% confidence interval is [0.182, 0.365].
Q: Calculate the critical z-value(s) for each of the given hypothesis test scenarios below. If multiple…
A: Given that
Q: What is the (conditional) probability that a patient actually has the disease given that the test is…
A: Let us define some events A : a patient has the disease. B : a patient does not have the disease. E…
Q: • Find the p-value for a two-tailed test of hypothesis for a mean when the test statistic has been…
A:
Q: Suppose that the Borda count method is used on the following preference table. If A drops ut, is the…
A:
Q: How many TV sets? A survey organization sampled 53 households in a community and found that the…
A:
Q: 19. Identify the false claim about conditional probabilities, given that P(E) > 0 and P(-E) > 0. All…
A: Option a: PA|E>PA|E¯PA and EPE>PA and E¯PE¯PA and EPE>PA-PA and EPE¯PA and E>PA-PA and…
Q: Using Excel, conduct a t-test (at the alpha = 0.05 significance level) on whether the mean of X1 is…
A:
Q: (a) Express the null hypothesis and the alternative hypothesis in symbolic form for the following…
A: a) The claim is that the average lunch break is more than 0.4 hours long.
Q: Student Expenditures The average expenditure per student (based on average daily attendance) for a…
A: From the provided information, Sample size (n) = 135 Sample mean (x̄) = 10590 Standard deviation (σ)…
Q: Identify if its TYPE 1 or TYPE II if there is any committed in each of the following situations. 1.…
A:
Q: What is the estimate of the parameter o in the regression model?
A: Given that The regression equation is y = -3.05 + 0.10x MS(error) = 1.40
Q: Suppose one would like to construct a 98% confidence interval for a sample mean, when the population…
A: Given that 98% confidence level Then level of significance=2%
Q: An insurance company crashed four cars of the same model at 5 miles per hour The costs of repair for…
A: Data given 425,428,463,248
Q: One earthquake occurred at 58° North latitude and had a magnitude of 1.4. What is the value of the…
A: The regression equation is given by y = -3.05 + 0.10x Where x = location of earthquake y = magnitude…
Q: Find the probability of getting exactly 6 girls in 8 births b. Find the probability of getting 6 or…
A: Given that n=8 Random variable x represents the number of girls among 8 children.
Q: pls answer no. 4 on paper the mean and standard dev is 4.1
A:
Q: A. Complete the table below for the summary of critical values and draw its respective rejection…
A: Critical value calculated from Z table at level of significance 8% and 4% for two tailed, left…
Q: 18.8 Drove when drinking alcohol. Table 18.7 presented cross-tabulated results for the number of…
A: The chi square test statistics value is given as 18.334 and degrees of freedom given as 2 and p…
Q: The National Quality Research Center at the University of Michigan provides a quarterly measure of…
A:
Q: Six people were asked about their daily TV viewing habits. The table beow shows the number of hours…
A: The measures of central tendency involves mean, median and mode. Mean is obtained by dividing the…
Q: b) The table below shows the ages and glucose levels of 6 indi Glucose Age (x) Level (y) 40 95 23 68…
A: Enter the data into the excel sheet as follows: Click on data>data analysis > regression.…
Q: What is the value of the sample correlation r?
A: It is given that Regression line : y = -3.05 + 0.10x Number of observations n = 13 Number of…
Q: INTERPRETING STATISTICAL TESTS 1. Below are the results of at-test comparing the (totally made up)…
A: Since you have posted multiple question, we will solve very first question for you. To get remaining…
Q: A 2016 survey of insurance professionals explores the use of technology in the industry. be most…
A: Graphs are extremely useful for representing data visually.
Q: A marketing researcher wishes to determine if over 60% of the wine drinkers prefer a certain brand…
A: It is given that Sample size n = 900 Number of drinkers prefer the brand of wine, X = 558
Q: If S-{0, 1, 2, 3, 4, 5, 6, 7, 8, 9} and A = {0, 2. 4, 6, 8], B- (1, 3, 5, 7, 9), C = {2, 3, 4, 5),…
A:
Q: From the results below, what test of association would be best to use with these two variables? List…
A: There are several measures of association depending on the type of variables.
Q: A professor was interested in studying how acedemic major (psychology vs. chemistry) is related to…
A: For the given statement Which statistical test should be usded for difference between psychology and…
Q: 6. Derive each of the following identities. (a) 9ry = 19 + 19y - 19zy (b) fr(t) = 19: tPy Hy+t + 19y…
A: Given qxy¯t=qxt+qyt-qxyt fTxy¯t=qxt pyt μy+t+qyt pxt μx+t qxy¯n|=qxn qyn|+qyn qxn|+qxn| qyn|
Q: Giyen otherwise othenanse [1-efy otherkise Find P(X$!, xe!) Find P/X8I) Find P(Y) Find p(X>6, 3er$8}
A:
Q: Find the z values for each of the following x values for a normal distribution with mean = 30 and a…
A: a) Consider that the mean and standard deviation of a random variable x are µ and σ, respectively.…
Q: An anger-management course claims that, after completing its seminar, participants will lose their…
A:
Q: Prof. X has been monitoring all stats students' anxiety levels by covertly measuring…
A: Option B
Q: a) In regression analysis, to obtain the least square estimators of a and B, the SSR of Squares of…
A:
Q: Identify the type of data. Continuous Numerical Data Discrete Numerical Data…
A: Given that Nominal data: Nominal data measure qualitative data and it is the name of variable.…
Q: Solve the given problems. 1. For a t-distribution with 25 degrees of freedom, find the values of te…
A:
Q: The owner of the store has determined that home delivery will be successful if the average time…
A: It is given that the P-value is 0.0290.
Q: Match the linear correlation coefficient to the scatter diagram. The scales on the x- and y-axes are…
A: From scatter plot here we have to find out scatter plot r value which are represented correct r…
Q: A doctor believes that the fruit and vegetable intake of Northern adolescents is different from the…
A: Know that Null hypothesis is denoted H0. And Alternative hypothesis is denoted H1. NOTE:- According…
Q: Suppose you are given the following two dimensional (2D) points. 3 3 1 10 15 8 1 7 10 10 12 11 When…
A: a b c d e f g h x 3 3 1 7 10 15 6 8 y 1 5 3 7 10 10 12 11 Manhattan Distance Formula…
Q: The heights of NBA players are normally distributed, with an average height of 6'7" (i.e. 79…
A: Let X be the random variable from Normal distribution with mean (μ) = 6'7" = 79 inches standard…
Q: Found h Rank Page Order 5.1 The following table represents the market share percentage for each firm…
A:
Q: Find 64th percentile, P64, from the following data 100 110 160 180 190 210 220 260 280 290 310 | 350…
A: Solution
Q: A cellphone provider has the business objective of wanting to determine the proportion of…
A: A hypothesis which is tested for plausible rejection is called the Null Hypothesis (typically…


Trending now
This is a popular solution!

Step by step
Solved in 2 steps with 2 images
