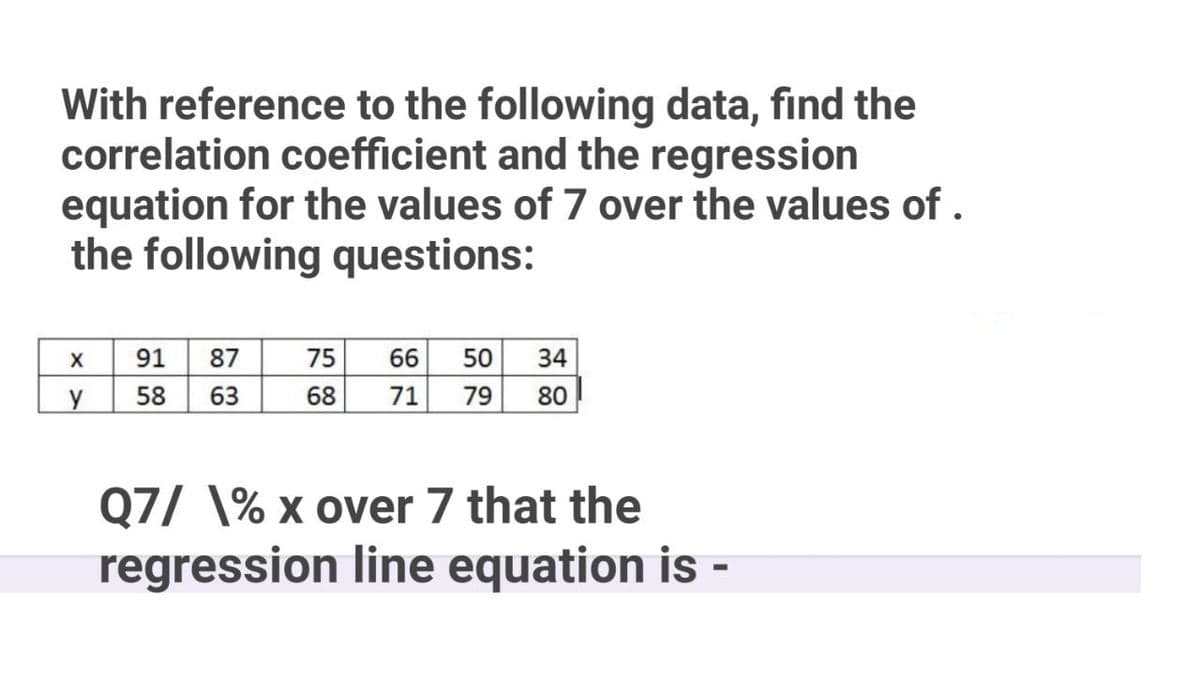
With reference to the following data, find the correlation coefficient and the regression equation for the values of 7 over the values of . the following questions: 91 87 58 63 75 66 50 34 68 71 79 80 Q7/ \% x over 7 that the regression line equation is -


Q: A pharmaceutical company is running tests to see how well its new drug lowers cholesterol. Eleven…
A: From the provided information, Sample size (n) = 11 Confidence level = 95%
Q: Mikasa
A: Note: As per answering guidelines I have to answer only one question at a time,.Please repost the…
Q: Given a random process X(t)= Acos a,t, where @, is a constant and A is uniformly distributed with…
A:
Q: A certain company wants to improve sales hence improve profit. Past sales data indicate that the…
A:
Q: Customers at the restaurant have to wait an average of 25 minutes before they receive their meal…
A: Standard normal distribution tables
Q: estimate a population mean μμ. Find the margin of error M.E. that corresponds to a sample of size 9…
A:
Q: Draw a comics strip on how to determine the appropriate tool when the variance is known, variance is…
A: The central limit theorem An essential component of the central limit theorem is that the…
Q: A. Determine the decision for each of the following given the computed and critical valu if the z or…
A: 1. Given: zCompute=1.02zCritical=1.64
Q: A USA Today/CNN/Gallup survey of 363 working parents found 204 who said they spend too little time…
A: Given that n=363,x =204
Q: The following table is the frequency distribution for the amount of hours worked per week by 100…
A: See below
Q: You simulate the following 35 random values from a distribution: 7 11 14 15 17 18 19 25 29 30 34 38…
A: For the given sample values,
Q: The table presents 19 random counties in a certain state grouped according to the county's dominant…
A: Given that table presents 19 random counties in a certain state grouped according to the county's…
Q: 6. Twelve dice were thrown 4096 times and a throw of 6 reckoned as a success; the observed…
A:
Q: A research on the effect of duodenal infusion of donor feces for recurrent Clostridium difficile…
A: For the given data Perform Chi square test
Q: Population or Sample? A.) SJS Travel Agency, a nationwide local travel special rates on summer…
A: It is sample.
Q: Suppose that hemoglobin levels in white males over age 11 are normally distributed with variance…
A: For the given data Perform z test for independent samples
Q: 7. Find the Q.D. and coefficient of Q.D. from the following data. auou Size Frequency 3.5 4.5 5.5…
A:
Q: You plan to invest in either a mutual fund X or mutual fund Y. The following information about the…
A:
Q: A lake contains n fish. A sample of m fish (m <n ) is caugh then returned to the lake. Later, a…
A: A lake contains n fish in total Sample 1 - m fish are caught where m< n Marked - m fish are…
Q: Solve the following problems. Show your complete solutions and interpret the results on a separate…
A: It seems that, there is a typo in the upper limit of the second class limit. It should be 50 instead…
Q: Consider the following preference profile: Applicant Preferences Hospital Preferences H H2 Ha HA As…
A:
Q: Suppose that the heights of adult women in the United States are normally distributed with a mean of…
A:
Q: Drug. Conc. Resp. Time. 0.5 1 1 1 1.5 1 2 1 2.5 1.5 3 3.5 2 4 2 4.5 2.5 5 4
A: Solution: As per the guidelines first three sub parts should be answered. If the remaining parts…
Q: A control chart is to be started for a new machine that fills boxes of cereal by weight. Five…
A: Solution: As per the guidelines first three parts should be answered. If the remaining parts needed…
Q: Suppose that IQ scores have a bell-shaped distribution with a mean of 95 and a standard deviation of…
A: Given: μ=95σ=15
Q: Problem Four: In a dental clinic with one dentist, the average number of patients from time to time…
A: Given that - In a dental clinic with one dentist, the average number of patients from time to time…
Q: Five die were thrown 96 times and the number of times 4, 5, or 6 was thrown were : No of die showing…
A:
Q: ndom sample of 17 registered nurses in a large hospital showed that they worked on average 43.7…
A: It is given that We have a random sample of size, n = 17 sample mean, x̄ = 43.7 sample standard…
Q: Ask 20 of your classmates about their favorite viand among the choices; ADOBO, SINIGANG and MENUDO.…
A:
Q: Sam is practising free-throws in basketball. She has a 4/5 chance of scoring each time she shoots…
A: Given probability of success, p = 4/5 Let X denote the number of free throws that she miss before…
Q: 14. Which of the following does not belong to the group? b. Interpretation 14. c. Possibilities 15.…
A: “Since you have asked multiple questions, we will solve the first question for you. If you want any…
Q: interval for the population mean number of text messages campers send home. 6. A survey of 500…
A: here use basic of confidence Interval
Q: UI 7 UBservations, the valués are 10, 11, 12, 13, 14, 15, 16. Find the 95% confidence interval for…
A: Given Sample size (n)=7
Q: 13. If t is the most efficient estimator of 0 and t another estimate with efficiency e, show that…
A:
Q: 2. A past study claims that adults in America spend an average of 17 hours a week on leisure…
A:
Q: III Determine the type of Kurtosis of the given sets of scores in 10 quizzes of two students. Graph…
A:
Q: If n=22, ¯xx¯(x-bar)=39, and s=6, find the margin of error at a 98% confidence level Give your…
A:
Q: A certain collector is choosing between 4 different paintings to buy. To help him decide, he asked…
A:
Q: Find 95% confidence interval for the population mean of all the light bulbs produced by the…
A:
Q: Ask 20 of your classmates about their favorite viand among the choices; ADOB0, SINIGANG and MENUDO.…
A: A probability is a mathematical or statistical way that shows the likelihood of an incident's…
Q: What is the correlation between the age and muscle strength of 10 randomly selected people?
A: For the given data What is the correlation between the age and muscle strength of 10 randomly…
Q: A college math teacher claims that the mean score of students in his Statistics class is greater…
A: For the given data Perform Z test for one mean
Q: 4. Show that if X and Y are independent random variables, then E(9(X)| X = ro) = g(ro). %3D
A: We need show that if X and Y are independent random variables, then E(g(X) | X = xo) = g(xo).
Q: 1. A random sample of enrollments from medical schools that specialize in research and from those…
A: In hypothesis testing we test the hypothesis regarding population parameter.
Q: On April 10, 2022, a certain newspaper reported the results of a public opinion poll that asked:…
A: For the given data Perform z test for one proportion
Q: Define the following concepts and where possible, give examples: (a) Formative assessment (b)…
A: We have to define Formative assessment Evaluation & Descriptive stastics
Q: You want to conduct a survey to determine the proportion of people who favor a proposed tax policy.…
A: From the provided information, We want to conduct a survey to determine the proportion of people who…
Q: 1. What is the probability that out 393 confirmed cases 198 has recovered? a. 198/393 b. 50.38% c.…
A: Note: As for the bartelby guidelines only three sub-parts can be answered. Kindly, repost with note…
Q: a. Eric is meeting Alyssa's flight, which departed on time. What is the probability that Alyssa will…
A:
Q: Q6. You joined a polling agency as a summer intern. You are helping them answer the following…
A: Given information: Given claim: Do a majority believe raising taxes will help the economy or is…


Trending now
This is a popular solution!

Step by step
Solved in 5 steps with 3 images

- Find the equation of the regression line for the following data set. x 1 2 3 y 0 3 4The following estimated regression equation based on 10 observations was presented. ŷ = 29.1260 + 0.5306x1 + 0.4680x2 The values of SST and SSR are 6,728.125 and 6,215.375, respectively. (a) Find SSE. SSE = (b) Compute R2. (Round your answer to three decimal places.) R2 = (c) Compute Ra2. (Round your answer to three decimal places.) Ra2 = (d) Comment on the goodness of fit. (For purposes of this exercise, consider a proportion large if it is at least 0.55.) The estimated regression equation provided a good fit as a small proportion of the variability in y has been explained by the estimated regression equation.The estimated regression equation did not provide a good fit as a small proportion of the variability in y has been explained by the estimated regression equation. The estimated regression equation provided a good fit as a large proportion of the variability in y has been explained by the estimated regression equation.The following estimated regression model was developed relating yearly income (y in $1000s) of 30 individuals with their age (x1) and their gender (x2) (0 if male and 1 if female).ŷ = 30 + 0.7x1 + 3x2Also provided are SST = 1200 and SSE = 384.The multiple coefficient of determination is _____.
- The following estimated regression equation based on 30 observations was presented. ŷ = 17.6 + 3.8x1 − 2.3x2 + 7.6x3 + 2.7x4 The values of SST and SSR are 1,808 and 1,780, respectively. (a) Compute R2. (b) Compute Ra2. (c) Comment on the goodness of fit.The following estimated regression equation based on 30 observations was presented. ŷ = 17.6 + 3.8x1 − 2.3x2 + 7.6x3 + 2.7x4 The values of SST and SSR are 1,807 and 1,757, respectively. (a) Compute R2. (Round your answer to three decimal places.) R2 = (b) Compute Ra2. (Round your answer to three decimal places.) Ra2 = (c) Comment on the goodness of fit. (For purposes of this exercise, consider a proportion large if it is at least 0.55.) The estimated regression equation did not provide a good fit as a large proportion of the variability in y has been explained by the estimated regression equation. The estimated regression equation provided a good fit as a large proportion of the variability in y has been explained by the estimated regression equation. The estimated regression equation provided a good fit as a small proportion of the variability in y has been explained by the estimated regression equation. The estimated regression equation did not provide a good…The following estimated regression equation based on 30 observations was presented. ŷ = 17.6 + 3.8x1 − 2.3x2 + 7.6x3 + 2.7x4 The values of SST and SSR are 1,801 and 1,758, respectively. (a)Compute R2. (Round your answer to three decimal places.) R2 = (b)Compute Ra2.(Round your answer to three decimal places.) Ra2 = (c) Comment on the goodness of fit. (For purposes of this exercise, consider a proportion large if it is at least 0.55.) The estimated regression equation provided a good fit as a small proportion of the variability in y has been explained by the estimated regression equation.The estimated regression equation did not provide a good fit as a large proportion of the variability in y has been explained by the estimated regression equation. The estimated regression equation did not provide a good fit as a small proportion of the variability in y has been explained by the estimated regression equation.The estimated regression equation provided a good fit as a…
- The following estimated regression model was developed relating yearly income (y in $1000s) of 30 individuals with their age (x1) and their gender (x2) (0 if male and 1 if female).ŷ = 30 + 0.7x1 + 3x2Also provided are SST = 1200 and SSE = 384.The yearly income of a 24-year-old female individual is _____.Consider the multiple regression for the following experiment: yi=b0+b1x1i+b2x2i+b3x3i+ei Where yi is the number of touchdowns, x1i is rushing yards, x2i is passing yards, and x3i is the “time of possession of the football” in minutes for that football team. Which of the following statements is true when making an interpretation of the sample slope coefficient? a) a. b2 represents the marginal change in passing yards for every additional touchdown, holding the other variables constant b) b. b2 represents the marginal change in touchdowns for every additional passing yard, holding the other variables constant c) c. b1 represents the marginal change in touchdowns for every additional passing yard, holding the other variables constant d) d. b3 represents the marginal change in touchdowns for every additional minute of time of possession, holding touchdowns constantIn a regression analysis involving 27 observations, the following estimated regressionequation was developed:yˆ 5 25.2 1 5.5x1For this estimated regression equation SST = 1550 and SSE = 520.a. At a = .05, test whether x1 is significant.Suppose that variables x2 and x3 are added to the model and the following regressionequation is obtained.yˆ 5 16.3 1 2.3x1 1 12.1x2 2 5.8x3For this estimated regression equation SST = 1550 and SSE = 100.
- The following estimated regression equation is based on 10 observations was presented. ŷ = 29.1270 + 0.5906x1 + 0.4980x2 . Here SST=6,724.125 , SSR = 6,216.375 , sb1 = 0.0813, sb2 = 0.0567. Compute MSR & MSE to 3 decimals, then compute F using the appropriate F test (round answer to 3 decimals). Use α = 0.05.Which of the following does not need to be computed to determine a simple regression line? SSx SP "Y-hat" SSyFrom the following data, determine if the data has a positive or a negative relationship with each other. Showcase the regression line, and determine if the data provided fits the approximate curve. Use the formula attached together with the given data.