Women in the Workforce (millions) 17.2 20.7 Women in the The following table gives the number of women age 16 years and older (in millions) in a country's civilian workforce for selected years from 1950 and projected to 2050. Workforce (millions) 75.9 77.3 Year Year Complete parts (a) and (b) below. 1950 2010 2015 2020 2030 2040 2050 1960 78.8 81.9 1970 1980 1990 2000 30.9 44.3 55.6 65.9 86.9 90.6 a. Use x as the number of years past January 1st, 1950 to create a cubic model, y, using these data. (Type integers or decimals rounded to five decimal places.) b. During what year does the model indicate that the number of women in the work force will reach its maximum? (Round down to the nearest year.)
Women in the Workforce (millions) 17.2 20.7 Women in the The following table gives the number of women age 16 years and older (in millions) in a country's civilian workforce for selected years from 1950 and projected to 2050. Workforce (millions) 75.9 77.3 Year Year Complete parts (a) and (b) below. 1950 2010 2015 2020 2030 2040 2050 1960 78.8 81.9 1970 1980 1990 2000 30.9 44.3 55.6 65.9 86.9 90.6 a. Use x as the number of years past January 1st, 1950 to create a cubic model, y, using these data. (Type integers or decimals rounded to five decimal places.) b. During what year does the model indicate that the number of women in the work force will reach its maximum? (Round down to the nearest year.)

Algebra & Trigonometry with Analytic Geometry
13th Edition
ISBN:9781133382119
Author:Swokowski
Publisher:Swokowski
Chapter10: Sequences, Series, And Probability
Section10.2: Arithmetic Sequences
Problem 68E

Related questions
Topic Video
Question
Transcribed Image Text:Women in the
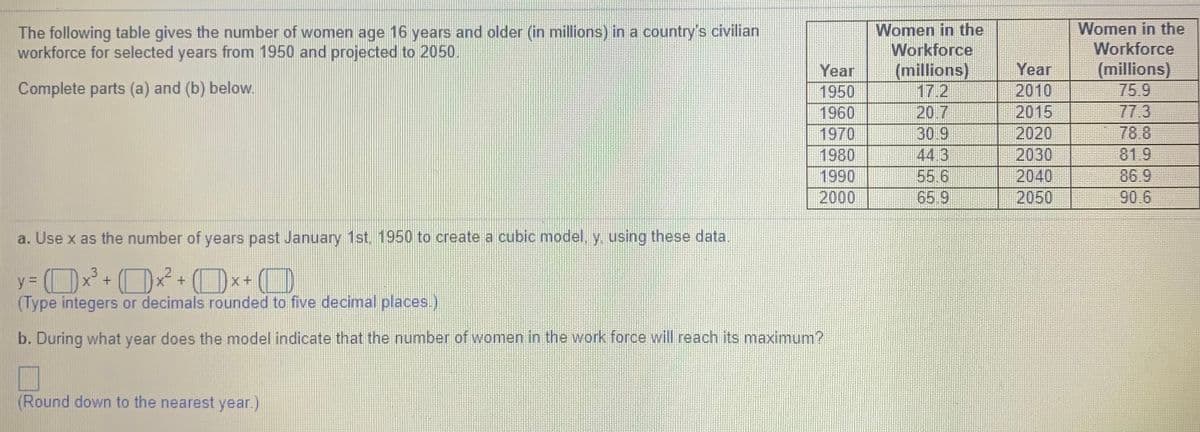
The following table gives the number of women age 16 years and older (in millions) in a country's civilian
workforce for selected years from 1950 and projected to 2050.
Women in the
Workforce
(millions)
17.2
20.7
Workforce
(millions)
75.9
77.3
78.8
81.9
Year
Year
Complete parts (a) and (b) below.
1950
2010
2015
2020
2030
1960
1970
30 9
1980
1990
2000
44 3
55.6
2040
2050
86.9
65 9
90 6
a. Use x as the number of years past January 1st. 1950 to create a cubic model, y, using these data.
+x
(Type integers or decimals rounded to five decimal places.)
b. During what year does the model indicate that the number of women in the work force will reach its maximum?
(Round down to the nearest year.)
Expert Solution
This question has been solved!
Explore an expertly crafted, step-by-step solution for a thorough understanding of key concepts.

This is a popular solution!

Trending now
This is a popular solution!

Step by step
Solved in 2 steps with 2 images

Knowledge Booster


Learn more about
Need a deep-dive on the concept behind this application? Look no further. Learn more about this topic, algebra and related others by exploring similar questions and additional content below.Recommended textbooks for you
Algebra & Trigonometry with Analytic Geometry
Algebra
ISBN:
9781133382119
Author:
Swokowski
Publisher:
Cengage

Linear Algebra: A Modern Introduction
Algebra
ISBN:
9781285463247
Author:
David Poole
Publisher:
Cengage Learning

Algebra & Trigonometry with Analytic Geometry
Algebra
ISBN:
9781133382119
Author:
Swokowski
Publisher:
Cengage
Linear Algebra: A Modern Introduction
Algebra
ISBN:
9781285463247
Author:
David Poole
Publisher:
Cengage Learning