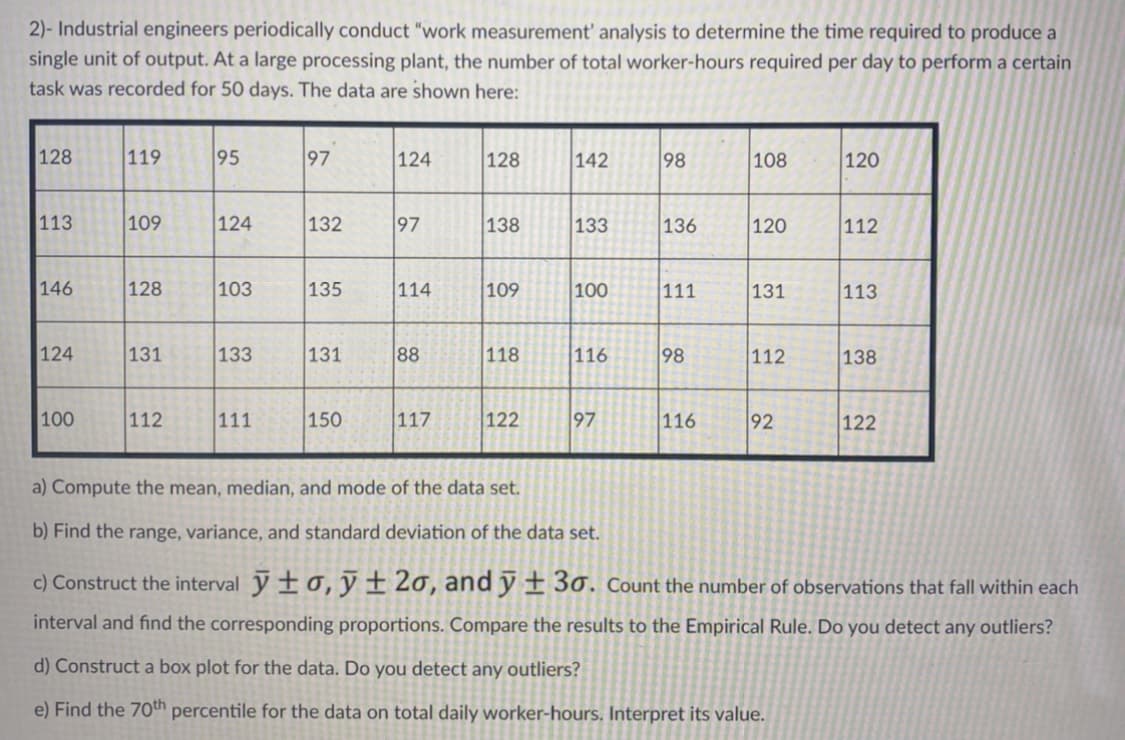
2)- Industrial engineers periodically conduct "work measurement' analysis to determine the time required to produce a single unit of output. At a large processing plant, the number of total worker-hours required per day to perform a certain task was recorded for 50 days. The data are shown here: 128 119 95 97 124 128 142 98 108 120 113 109 124 132 97 138 133 136 120 112 146 128 103 135 114 109 100 111 131 113 124 131 133 131 88 118 116 98 112 138 100 112 111 150 117 122 97 116 92 122 a) Compute the mean, median, and mode of the data set. b) Find the range, variance, and standard deviation of the data set. c) Construct the interval yt0, y ± 2o, and y ± 30. Count the number of observations that fall within each interval and find the corresponding proportions. Compare the results to the Empirical Rule. Do you detect any outliers? d) Construct a box plot for the data. Do you detect any outliers? e) Find the 70th percentile for the data on total daily worker-hours. Interpret its value.


Inverse Normal Distribution
The method used for finding the corresponding z-critical value in a normal distribution using the known probability is said to be an inverse normal distribution. The inverse normal distribution is a continuous probability distribution with a family of two parameters.
Mean, Median, Mode
It is a descriptive summary of a data set. It can be defined by using some of the measures. The central tendencies do not provide information regarding individual data from the dataset. However, they give a summary of the data set. The central tendency or measure of central tendency is a central or typical value for a probability distribution.
Z-Scores
A z-score is a unit of measurement used in statistics to describe the position of a raw score in terms of its distance from the mean, measured with reference to standard deviation from the mean. Z-scores are useful in statistics because they allow comparison between two scores that belong to different normal distributions.


Trending now
This is a popular solution!

Step by step
Solved in 5 steps with 1 images


