World supply of recycled silver, Q, in millions of ounces and the price of silver, P, in dollars per ounce, each year are given in the table below. Year 2011 2012 2013 2014 2015 2016 2017 2018 2019 2020 Q 232.9 216.0 192.7 174.9| 166.5 164.4 167.7 167.7 169.9 169.4 35.12 31.15 23.79 19.08 15.68 17.14 17.05 15.71 16.21 15.7O Which of the following figures show possible supply curves for the the data? Select all possible correct choices. O P (milion $/oz) 35 F 25 F 15 Q (million ozs) 240 160 180 200 220 O P (milion $/oz) 35 25 15 Q (million ozs) 240 160 180 200 220 O P (milion $/oz) 35 25 15 5. Q (million ozs) 240 160 180 200 220 O P (milion $/oz) 35 F 25 15 - Q (million ozs) 240 160 180 200 220
World supply of recycled silver, Q, in millions of ounces and the price of silver, P, in dollars per ounce, each year are given in the table below. Year 2011 2012 2013 2014 2015 2016 2017 2018 2019 2020 Q 232.9 216.0 192.7 174.9| 166.5 164.4 167.7 167.7 169.9 169.4 35.12 31.15 23.79 19.08 15.68 17.14 17.05 15.71 16.21 15.7O Which of the following figures show possible supply curves for the the data? Select all possible correct choices. O P (milion $/oz) 35 F 25 F 15 Q (million ozs) 240 160 180 200 220 O P (milion $/oz) 35 25 15 Q (million ozs) 240 160 180 200 220 O P (milion $/oz) 35 25 15 5. Q (million ozs) 240 160 180 200 220 O P (milion $/oz) 35 F 25 15 - Q (million ozs) 240 160 180 200 220

Linear Algebra: A Modern Introduction
4th Edition
ISBN:9781285463247
Author:David Poole
Publisher:David Poole
Chapter3: Matrices
Section3.7: Applications
Problem 44EQ

Related questions
Question
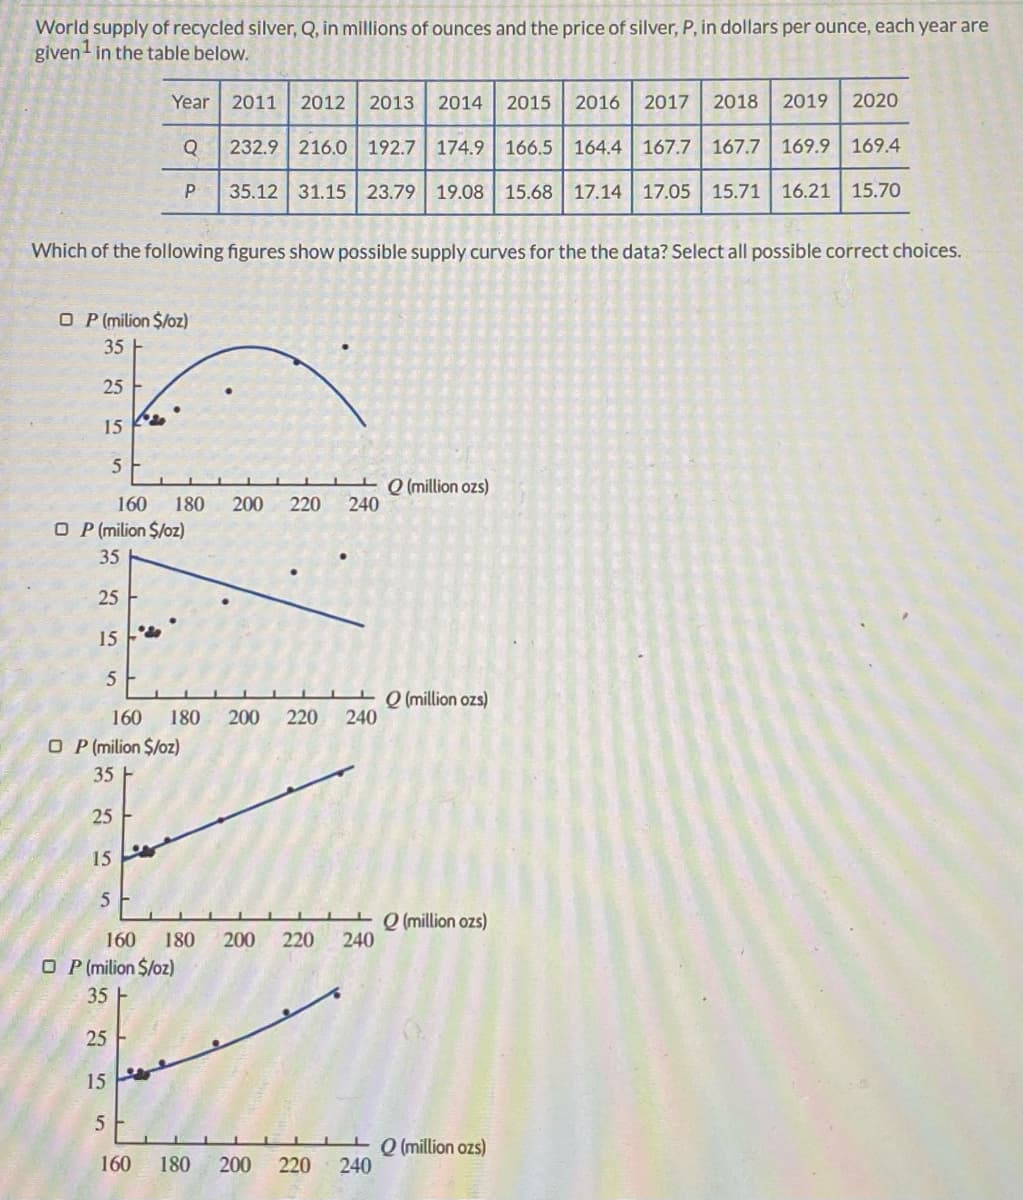
Transcribed Image Text:World supply of recycled silver, Q, in millions of ounces and the price of silver, P, in dollars per ounce, each year are
given in the table below.
Year 2011
2012
2013
2014
2015
2016 2017
2018
2019
2020
Q
232.9 216.0 192.7
174.9 166.5 164.4 167.7 167.7 169.9 169.4
P.
35.12 31.15 23.79
19.08 15.68 17.14 17.05 15.71
16.21 15.7O
Which of the following figures show possible supply curves for the the data? Select all possible correct choices.
O P (milion $/oz)
35 H
25
15
5
+ O (million ozs)
240
160
180
200 220
O P (milion $/oz)
35
25
15
- O (million ozs)
240
160
180
200
220
O P (milion $/oz)
35 F
25
15
+ O (million ozs)
240
160
180
200
220
O P (milion $/oz)
35 H
25
15
Q (million ozs)
240
160
180
200
220
Expert Solution
This question has been solved!
Explore an expertly crafted, step-by-step solution for a thorough understanding of key concepts.

This is a popular solution!

Trending now
This is a popular solution!

Step by step
Solved in 2 steps with 1 images

Recommended textbooks for you
Linear Algebra: A Modern Introduction
Algebra
ISBN:
9781285463247
Author:
David Poole
Publisher:
Cengage Learning

Algebra & Trigonometry with Analytic Geometry
Algebra
ISBN:
9781133382119
Author:
Swokowski
Publisher:
Cengage

Functions and Change: A Modeling Approach to Coll…
Algebra
ISBN:
9781337111348
Author:
Bruce Crauder, Benny Evans, Alan Noell
Publisher:
Cengage Learning
Linear Algebra: A Modern Introduction
Algebra
ISBN:
9781285463247
Author:
David Poole
Publisher:
Cengage Learning
Algebra & Trigonometry with Analytic Geometry
Algebra
ISBN:
9781133382119
Author:
Swokowski
Publisher:
Cengage
Functions and Change: A Modeling Approach to Coll…
Algebra
ISBN:
9781337111348
Author:
Bruce Crauder, Benny Evans, Alan Noell
Publisher:
Cengage Learning