Write the equation of the straight line

Algebra & Trigonometry with Analytic Geometry
13th Edition
ISBN:9781133382119
Author:Swokowski
Publisher:Swokowski
Chapter5: Inverse, Exponential, And Logarithmic Functions
Section: Chapter Questions
Problem 45RE

Related questions
Question
Write the equation of the straight line.
Transcribed Image Text:1
2
3
4
5
6
7
8
9
10
11
12
13
14
15
16
17
18
19
20
21
22
23
24
25
26
27
28
29
30
31
A
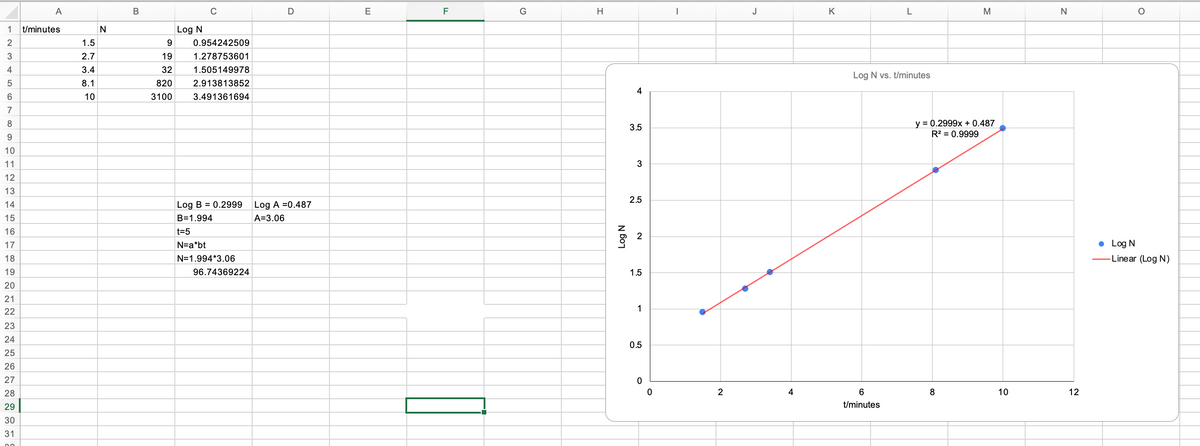
t/minutes
1.5
2.7
3.4
8.1
10
N
B
Log N
9
C
0.954242509
19
1.278753601
32 1.505149978
820
2.913813852
3100 3.491361694
Log B = 0.2999 Log A =0.487
B=1.994
A=3.06
t=5
N=a*bt
N=1.994*3.06
D
96.74369224
E
F
G
H
Log N
4
3.5
3
2.5
N
1.5
1
0.5
0
0
2
J
4
K
L
Log N vs. t/minutes
6
t/minutes
M
y = 0.2999x + 0.487
R² = 0.9999
8
10
N
12
O
● Log N
-Linear (Log N)
Expert Solution
This question has been solved!
Explore an expertly crafted, step-by-step solution for a thorough understanding of key concepts.

Step by step
Solved in 2 steps

Recommended textbooks for you
Algebra & Trigonometry with Analytic Geometry
Algebra
ISBN:
9781133382119
Author:
Swokowski
Publisher:
Cengage
Algebra & Trigonometry with Analytic Geometry
Algebra
ISBN:
9781133382119
Author:
Swokowski
Publisher:
Cengage