Write your complete solutions. The final test and exam averages for 20 randomly selected students taking a course in engineering statistics and a course in operations research are in the table below. Assume that the final averages are jointly normally distributed. (a) Find the regression line relating the statistics final average to the OR final average. Graph the data. (b) Test for significance of regression using a = 0.05. (c) Estimate the correlation coefficient.
Write your complete solutions. The final test and exam averages for 20 randomly selected students taking a course in engineering statistics and a course in operations research are in the table below. Assume that the final averages are jointly normally distributed. (a) Find the regression line relating the statistics final average to the OR final average. Graph the data. (b) Test for significance of regression using a = 0.05. (c) Estimate the correlation coefficient.

Functions and Change: A Modeling Approach to College Algebra (MindTap Course List)
6th Edition
ISBN:9781337111348
Author:Bruce Crauder, Benny Evans, Alan Noell
Publisher:Bruce Crauder, Benny Evans, Alan Noell
Chapter3: Straight Lines And Linear Functions
Section3.CR: Chapter Review Exercises
Problem 15CR: Life Expectancy The following table shows the average life expectancy, in years, of a child born in...

Related questions
Question
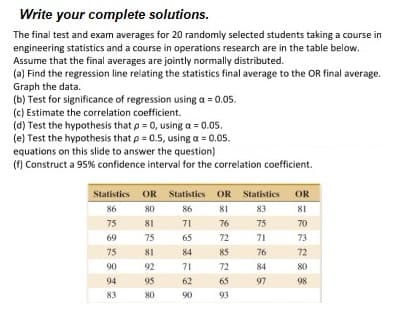
Transcribed Image Text:Write your complete solutions.
The final test and exam averages for 20 randomly selected students taking a course in
engineering statistics and a course in operations research are in the table below.
Assume that the final averages are jointly normally distributed.
(a) Find the regression line relating the statistics final average to the OR final average.
Graph the data.
(b) Test for significance of regression using a = 0.05.
(c) Estimate the correlation coefficient.
(d) Test the hypothesis that p = 0, using a = 0.05.
(e) Test the hypothesis that p = 0.5, using a = 0.05.
equations on this slide to answer the question)
(f) Construct a 95% confidence interval for the correlation coefficient.
Statistics OR Statistics OR Statistics OR
86
80
86
81
83
81
75
81
71
76
75
69
75
65
72
71
75
81
84
85
90
92
71
72
94
95
62
65
83
80
90
93
76
84
97
70
73
72
80
98
Expert Solution
This question has been solved!
Explore an expertly crafted, step-by-step solution for a thorough understanding of key concepts.

Step by step
Solved in 3 steps with 2 images

Recommended textbooks for you
Functions and Change: A Modeling Approach to Coll…
Algebra
ISBN:
9781337111348
Author:
Bruce Crauder, Benny Evans, Alan Noell
Publisher:
Cengage Learning

Glencoe Algebra 1, Student Edition, 9780079039897…
Algebra
ISBN:
9780079039897
Author:
Carter
Publisher:
McGraw Hill

Functions and Change: A Modeling Approach to Coll…
Algebra
ISBN:
9781337111348
Author:
Bruce Crauder, Benny Evans, Alan Noell
Publisher:
Cengage Learning
Glencoe Algebra 1, Student Edition, 9780079039897…
Algebra
ISBN:
9780079039897
Author:
Carter
Publisher:
McGraw Hill

Big Ideas Math A Bridge To Success Algebra 1: Stu…
Algebra
ISBN:
9781680331141
Author:
HOUGHTON MIFFLIN HARCOURT
Publisher:
Houghton Mifflin Harcourt

Holt Mcdougal Larson Pre-algebra: Student Edition…
Algebra
ISBN:
9780547587776
Author:
HOLT MCDOUGAL
Publisher:
HOLT MCDOUGAL