X bx. y 12.4 0.3 18.3 9.7 -0.6 3.9 -8.9 -2.7 17.1 -4.5 ariable Suppose that a simple linear regression model is used to estimate the relationship between X and Y, using y = a


Q: Provide an appropriate response. 42) The number of books sold over the course of the four-day book…
A:
Q: Suppose you need to compute a 90% confidence interval for a population mean. a. If you assume the…
A: Hello! As you have posted more than 3 sub parts, we are answering the first 3 sub-parts. In case…
Q: The admission team at a new university are trying to predict the number of student application they…
A: The admission team at a new university are trying to predict the number of student applications they…
Q: A magazine collected the ratings for food, decor, service and the cost per person for a sample of…
A: The given model is Y^i=-25.002+1.0004Xi.
Q: Cesar wants to know what the expected weight of a loaf of bread for quality control purposes. Based…
A:
Q: In a clinical trial of a certain drug, 30 subjects experience headaches among the 221 subjects…
A: given data n = 221x = 30construct 99% ci for p.
Q: An independent sample t test provides the following data: Size of sample A is 16, size of sample B…
A: GivenSample size for A(n1) = 16Sample Variance(s21) of sample A =60.8Sample size for B(n2)=16Sample…
Q: QUESTION 13 How many simple random samples of size 3 can be selected from a population of size 8? a.…
A: Given N=8, n=3 Farmula used r!=r(r-1)(r-2)×...×3×2×1
Q: The measurements of spread or scatter of the individual values around the central point is called…
A: we have to find term used for measurements of spread or scatter of the individual values around the…
Q: . Explain the differences in the results from (a) and (b). Choose the correct answer below. OA.…
A: We usually use two types of interval in regression analysis Confidence interval and Prediction…
Q: A random sample of 35 high-school students averaged 7.3 hours of sleep per night. Assume a…
A: Obtain the 95% confidence interval for the population mean. The 95% confidence interval for the…
Q: unit. The production cost is given by a discrete distribution that 60% the cost is about $20 per…
A:
Q: Using diaries for many weeks, a study on the lifestyles of visually impaired students was conducted.…
A: It is given that Mean, μ = 8.2 Standard deviation, σ = 2.2 Z-Score, Z = ( X - μ )/σ
Q: The Pasadena fire department aims to respond to fire calls in 8 minutes or less, on average.…
A: GIVEN DATA, normal distributionσ=1 minute 48 secound =1*60+48=108 secound n=18x¯=8 minute 49…
Q: Your engineering position requires frequent travel to the west coast, typically through Chicago. In…
A:
Q: n a random sample of 100 customers in Washington, the company found that the average sale was $7.87…
A: Comment: As per the our company guidelines we are supposed to answer only one question. Kindly…
Q: The average teacher's salary in Connecticut (ranked first among states) is $57,337 . Suppose that…
A: GivenMean(μ)=57337standard deviation(σ)=7500
Q: a) Rolling a die 6 times and observing the number of spots. b) Rolling a die 6 times and observing…
A: As PER POLICY I HAVE CALCULATED FIRST 3 SUBPARTS Here use Conditions of Binomial distribution.…
Q: The ANOVA summary table to the right is for a multiple regression model with six independent…
A: Regression mean square, MSR= SSR/dfR MSR= 240/6 MSR= 40 Mean square error = SSR/dfE = 190/26…
Q: a. Interpret the meaning of the Y-intercept, bo Interpret the meaning of the slope, b1
A: Given straight line equation isYi^=16-0.4Xi
Q: 2. A teacher from the College of Business Administration of UPang is using the Test-Retest Method to…
A: Given that: Student Scores 1st Test 2nd Test 1 75 79 2 80 81 3 81 80 4 79 82 5 75 78…
Q: The extract of a plant native to Taiwan has been tested as a possible treatment for Leukemia. One of…
A: GIvenMean(μ)=61standard deviation(σ)=5.9
Q: QUESTION 5 A standard normal distribution is a normal distribution with a. a mean of 1 and a…
A: Method : standard Normal distribution having Mean= 0 and standard deviation = 1
Q: Two-digit natural numbers are formed, with replacement, from the digits 0 through 9. How many…
A: In question, Given that two-digit natural numbers are formed, with replacement, from the digits 0…
Q: Refer to the accompanying data set of mean drive-through service times at dinner in seconds at two…
A: The sample mean and sample standard deviation are computed as follows:
Q: ONE STUDENT IS PICKED AT RANDOM, FIND: (A) P(A) (B) P(M) (C) P(A/H) (D) P(H/S) (E)
A: The general formula to calculate the probability of event A is P(event A) = Number of favorable…
Q: Claims Probability 1 2 3 4 5 U 0.2 0.2 0.1 0.25 0.25 Find the percentage of claims within one…
A: Given that Claims Probability 1 0.2 2 0.2 3…
Q: How do critical t-values change as the number of observations increases? Why? They go down…
A: t-value = (Sample mean - Pop. mean)/(pop. SD/√n) Understand : Population remain same : Sample…
Q: An article in Knee Surgery, Sports Traumatology, Arthroscopy ["Arthroscopic Meniscal Repair with an…
A: Givensample size(n)=37x=25sample proportion(p^)=xn=2537p^=0.675676p^≅0.676confidence level=95%
Q: Mathematical modelling is a tool to uncover relationships about observable quantities in the…
A:
Q: Use the following cell phone airport data speeds (Mbps) from a particular network. Find the…
A: A percentile is a number below which a specific portion of test score fall. We can formulate it as…
Q: Angela was not able to sell her house for $280,000, so she lowered the price to $260,000. What was…
A: Initial price = $280,000 Final price = $ 260,000 Percentage of decrease = ?
Q: If X₁ ... ... X are independent gamma random variables alongside the MGF of a gamma variable. What…
A:
Q: c. Construct and interpret a 95% confidence interval estimate for the difference between…
A: Given that Sample sizes n1 =410 , n2=167 Sample proportion p1^=0.77 , p2^=0.89
Q: 29) P(-0.73<z<2.27)
A: From the provided information, The probability expression is as follow: P (-0.73 < z < 2.27)
Q: During the last few days M Oil Company has requested rate increases several times. As a result of…
A: When number of data points are even, median is calculated by the formula median=(n2)th+(n2+1)th2
Q: Dana is a math professor who usually teaches in-person but has recently started teaching online.…
A: Given that, mean , μ=76.5standard deviation,σ=19.1and sample mean(class-average),x =68.4 and sample…
Q: In a recent year, Delaware had the highest per capita annual income with $51,803 . If =σ$4850 ,…
A: Mean=51803, standard deviations σ=4850, n=39
Q: Engineers want to design seats in commercial aircraft so that they are wide enough to fit 90% of all…
A: GIVEN DATA μ = 14.3σ = 0.9find P90 = ?
Q: 3. The Dean of the College of Engineering of UPang undertakes a study to relate the starting salary…
A: Pearson product moment orrelation coefficient are user to measure the linear relationship between…
Q: For data description from stata, what kind of information is needed for the following, give an…
A: t-test: A hypothesis test for comparing two independent population means using the means of two…
Q: Below is a probability distribution for a discrete random variable. X P(X) 5 0.25 7 0.30 11 0.35…
A: Note-according to the Bartleby question answer guidelines expert can solve maximum one question and…
Q: Assume that all grade-point averages are to be standardized on a scale between 0 and 6. How many…
A: The standard deviation is 1.5 and confidence level is 95%.
Q: around social and environmental considerations. Refer to the Business and Society (March 2011) study…
A: b. Suppose µ is the population mean level of support for all senior managers at CPA firms.
Q: 33) If z is a standard normal variable, find P(Z > 0.97). A) 0.1660 B) 0.1685 C) 0.8340 D) 0.1922
A: GivenP(z>0.97)
Q: Assume that X has a cumulative distribution function of e ∙e -(x-a) B positive real number. Find…
A:
Q: 65. Scholarship Examination Scores. At Western University the historical mean of scholarship…
A:
Q: 12. Suppose that annual precipitation is normally distributed, with mean 50 inches, and standard…
A: given data,normal distributionμ=50σ=12we have to find out the 65th percentile for given data.
Q: Discuss the two forms of the regression equation, raw score and z score, and their verbal…
A:
Q: Find the sample size needed to estimate the percentage of adults who can wiggle their ears. Use a…
A: GIVEN DATA,margin of error =1%=0.01CI=0.95α=1-0.95=0.05Zc=Zα/2=Z0.05/2=Z0.025=1.96 [ from excel…
How to determine a and b from table?
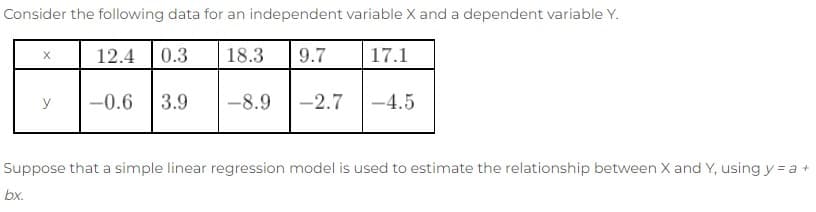

Step by step
Solved in 3 steps with 2 images

- The following fictitious table shows kryptonite price, in dollar per gram, t years after 2006. t= Years since 2006 0 1 2 3 4 5 6 7 8 9 10 K= Price 56 51 50 55 58 52 45 43 44 48 51 Make a quartic model of these data. Round the regression parameters to two decimal places.Olympic Pole Vault The graph in Figure 7 indicates that in recent years the winning Olympic men’s pole vault height has fallen below the value predicted by the regression line in Example 2. This might have occurred because when the pole vault was a new event there was much room for improvement in vaulters’ performances, whereas now even the best training can produce only incremental advances. Let’s see whether concentrating on more recent results gives a better predictor of future records. (a) Use the data in Table 2 (page 176) to complete the table of winning pole vault heights shown in the margin. (Note that we are using x=0 to correspond to the year 1972, where this restricted data set begins.) (b) Find the regression line for the data in part ‚(a). (c) Plot the data and the regression line on the same axes. Does the regression line seem to provide a good model for the data? (d) What does the regression line predict as the winning pole vault height for the 2012 Olympics? Compare this predicted value to the actual 2012 winning height of 5.97 m, as described on page 177. Has this new regression line provided a better prediction than the line in Example 2?Consider the following data for two variables, x and y. x 9 32 18 15 26 y 9 19 20 15 22 Develop an estimated regression equation for the data of the form ŷ = b0 + b1x + b2x2. (Round b0 to two decimal places and b1 to three decimal places and b2 to four decimal places.) ŷ = (c) Use the model from part (b) to predict the value of y when x = 20. (Round your answer to two decimal places.)
- Consider the following data for two variables, x and y. x 22 24 26 30 35 40 y 11 21 34 36 39 36 Develop an estimated regression equation for the data of the form ŷ = b0 + b1x + b2x2. (Round b0 to one decimal place and b1 to two decimal places and b2 to four decimal places.) ŷ = (e) Use the results from part (d) to test for a significant relationship between x, x2, and y. Use ? = 0.05. Is the relationship between x, x2, and y significant? Find the value of the test statistic. (Round your answer to two decimal places.) Find the p-value. (Round your answer to three decimal places.) p-value = (f) Use the model from part (d) to predict the value of y when x = 25. (Round your answer to three decimal places.)Consider the following data set. x 1 2 3 4 5 y 2.2 2 1.9 1.6 1.1 Find the equation of the regression line. (Round the values to two decimal places.) y =Use the sample linear regression line Y^=2+3X for the data points below to answer the following questions. X 0 3 7 10 Y 5 5 27 31 1) What is the fitted value when X2=3? 2) What is the regression residual when X2=3?
- Consider the following data for a dependent variable y and two independent variables, x1 and x2. x1 x2 y 30 12 94 47 10 108 25 17 112 51 16 178 40 5 94 51 19 175 74 7 170 36 12 117 59 13 142 76 16 211 (a) Develop an estimated regression equation relating y to x1. (Round your numerical values to one decimal place.) ŷ = Predict y if x1 = 51. (Round your answer to one decimal place.) (b) Develop an estimated regression equation relating y to x2. (Round your numerical values to one decimal place.) ŷ = Predict y if x2 = 19. (Round your answer to one decimal place.) (c) Develop an estimated regression equation relating y to x1 and x2. (Round your numerical values to one decimal place.) ŷ = Predict y if x1 = 51 and x2 = 19. (Round your answer to one decimal place.)A statistical program is recommended. Consider the following data for two variables, x and y. x 22 24 26 30 35 40 y 12 22 34 36 41 37 (d) Develop an estimated regression equation for the data of the form ŷ = b0 + b1x + b2x2. (Round b0 to one decimal place and b1 to two decimal places and b2 to four decimal places.) ŷ = −175+12.63x−.1837x2 Use the results from part (d) to test for a significant relationship between x, x2, and y. Use α = 0.05. Is the relationship between x, x2, and y significant? Find the value of the test statistic. (Round your answer to two decimal places.) Find the p-value. (Round your answer to three decimal places.)Consider the following data: A. Find the equation of the regression line. B. Estimate the value of y when x = 15 x 1 2 3 4 5 6 7 y 2 6 4 8 12 10 12
- The following scores represent a nurse’s assessment (X) and a physician’s assessment (Y) of the condition of 10 patients at time of admission to a trauma centre: X: 18 13 18 15 10 12 8 4 7 3 Y: 23 20 18 16 14 11 10 7 6 4 a) Obtain the regression equation. b) What is the predicted physician’s assessment for a nurse’s assessment of; 16 scores? 21 scores? c) Distinguish between extrapolation and interpolationFor the following set of scores: X Y 0 16 1 6 2 9 3 0 4 9 (a) Compute the Pearson correlation.r = (b) Find the regression equation for predicting Y from X.Y = X +A researcher conducted a number of descriptive statistics for two variables X and Y. They were as follows: SP = -20; SSx = 4; My = 7; Mx = 3 What is b equal to? What is a equal to? Using b and a construct a regression equation, and then using the regression equation, calculate the value of predicted Y when X = 2?

