x Y 1 6 3 16 5 26 7 36 1051 a) Graph the Scatter Plot with the trendline and R', Attach a picture of the graph with trendline and R' b) Can a linear function model exactly the points from the table? Explain
x Y 1 6 3 16 5 26 7 36 1051 a) Graph the Scatter Plot with the trendline and R', Attach a picture of the graph with trendline and R' b) Can a linear function model exactly the points from the table? Explain

Algebra & Trigonometry with Analytic Geometry
13th Edition
ISBN:9781133382119
Author:Swokowski
Publisher:Swokowski
Chapter3: Functions And Graphs
Section3.3: Lines
Problem 30E

Related questions
Question
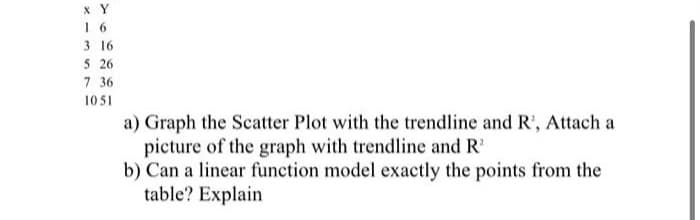
Transcribed Image Text:xY
1 6
3 16
5 26
7 36
1051
a) Graph the Scatter Plot with the trendline and R', Attach a
picture of the graph with trendline and R'
b) Can a linear function model exactly the points from the
table? Explain
Expert Solution
This question has been solved!
Explore an expertly crafted, step-by-step solution for a thorough understanding of key concepts.

Step by step
Solved in 3 steps with 3 images

Recommended textbooks for you
Algebra & Trigonometry with Analytic Geometry
Algebra
ISBN:
9781133382119
Author:
Swokowski
Publisher:
Cengage

Functions and Change: A Modeling Approach to Coll…
Algebra
ISBN:
9781337111348
Author:
Bruce Crauder, Benny Evans, Alan Noell
Publisher:
Cengage Learning
Algebra & Trigonometry with Analytic Geometry
Algebra
ISBN:
9781133382119
Author:
Swokowski
Publisher:
Cengage
Functions and Change: A Modeling Approach to Coll…
Algebra
ISBN:
9781337111348
Author:
Bruce Crauder, Benny Evans, Alan Noell
Publisher:
Cengage Learning