Sketch by hand a scatterplot of the number of uninsured people in 2007 (as the response variable) against the number in 2006 (as the explanatory variable) from the table. Make sure you include appropriate plot title and axis labels. Describe the 4 features observable from the scatterplot. Is the age group "65 years and older" an influential observation? BI U A Ix x x, = E 12pt Paragraph fx
Sketch by hand a scatterplot of the number of uninsured people in 2007 (as the response variable) against the number in 2006 (as the explanatory variable) from the table. Make sure you include appropriate plot title and axis labels. Describe the 4 features observable from the scatterplot. Is the age group "65 years and older" an influential observation? BI U A Ix x x, = E 12pt Paragraph fx

Holt Mcdougal Larson Pre-algebra: Student Edition 2012
1st Edition
ISBN:9780547587776
Author:HOLT MCDOUGAL
Publisher:HOLT MCDOUGAL
Chapter11: Data Analysis And Probability
Section11.5: Interpreting Data
Problem 1C

Related questions
Question
PLEASE HELP!!!
Transcribed Image Text:Sketch by hand a scatterplot of the number of uninsured people in 2007 (as the response
variable) against the number in 2006 (as the explanatory variable) from the table. Make sure
you include appropriate plot title and axis labels. Describe the 4 features observable from the
scatterplot. Is the age group "65 years and older" an influential observation?
B I UA
를 Ξ
x x, = E
A
12pt
Paragraph
EDE P
fx
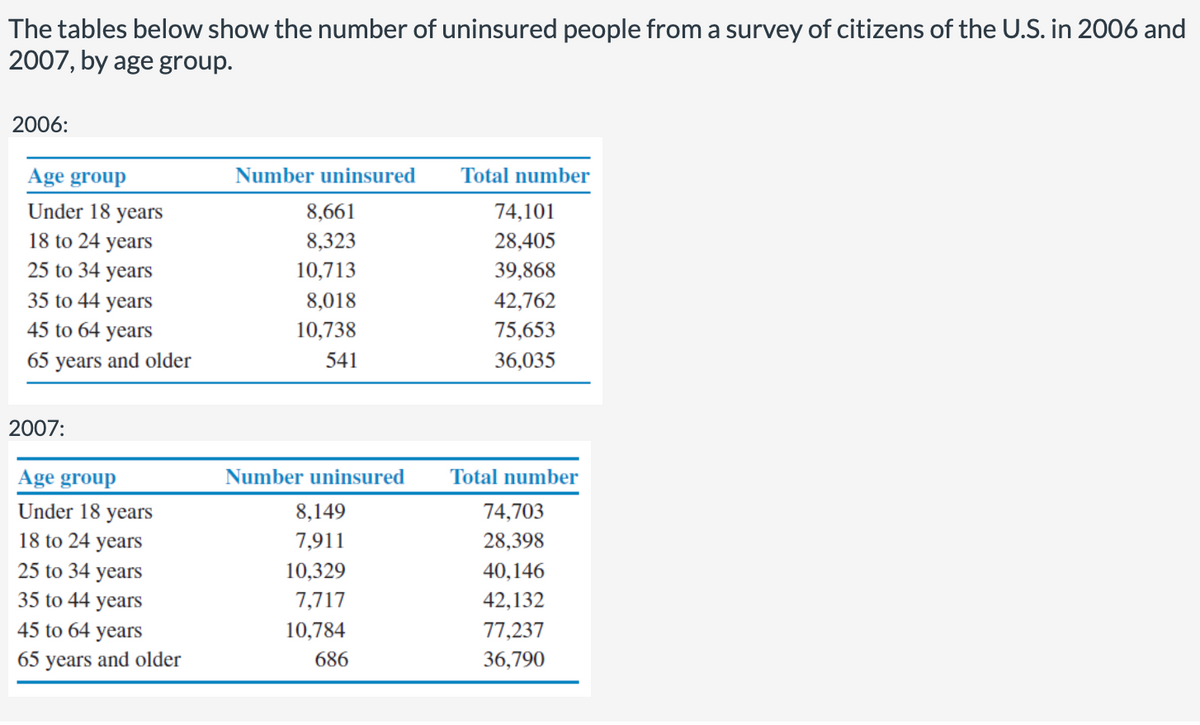
Transcribed Image Text:The tables below show the number of uninsured people from a survey of citizens of the U.S. in 2006 and
2007, by age group.
2006:
Age group
Number uninsured
Total number
Under 18 years
18 to 24 years
25 to 34 years
8,661
74,101
8,323
28,405
10,713
39,868
35 to 44 years
8,018
42,762
45 to 64 years
10,738
75,653
65 years and older
541
36,035
2007:
Age group
Under 18 years
Number uninsured
Total number
8,149
74,703
18 to 24 years
7,911
28,398
25 to 34 years
10,329
40,146
35 to 44 years
7,717
42,132
45 to 64 years
10,784
77,237
65 years and older
686
36,790
Expert Solution
Step 1
Given Information:
Consider the data that shows the number of uninsured people from a survey of citizens of the U.S in 2006 and 2007.
| Number uninsured (2006) X | Number uninsured (2007) Y |
| 8661 | 8149 |
| 8323 | 7911 |
| 10713 | 10,329 |
| 8018 | 7717 |
| 10738 | 10,784 |
| 541 | 686 |
Number of Uninsured people (2006) = Explanatory variable.
Number of Uninsured people (2007)=Response variable.

Step by step
Solved in 3 steps with 1 images

Recommended textbooks for you
Holt Mcdougal Larson Pre-algebra: Student Edition…
Algebra
ISBN:
9780547587776
Author:
HOLT MCDOUGAL
Publisher:
HOLT MCDOUGAL


Holt Mcdougal Larson Pre-algebra: Student Edition…
Algebra
ISBN:
9780547587776
Author:
HOLT MCDOUGAL
Publisher:
HOLT MCDOUGAL