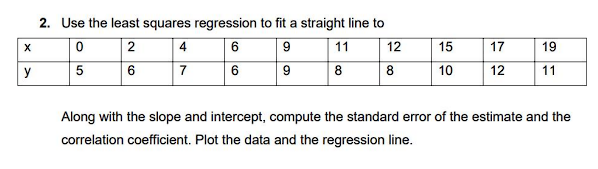
X y 2. Use the least squares regression to fit a straight line to 0 2 6 9 5 6 6 9 4 7 11 8 12 8 15 10 17 12 19 11 Along with the slope and intercept, compute the standard error of the estimate and the correlation coefficient. Plot the data and the regression line.


Q: dy Consider the differential equation 25y36x=0, which has a one-parameter family of implicit…
A:
Q: The sum of the geometric series Σ=o 4n+1 52-2 is 100 O 500 O 200 O 400 O None of them O
A:
Q: 4. Consider the forced undamped system described by the initial value probler u" + 2u = 2 cos(wt),…
A:
Q: Nearly a third can be used to represent
A:
Q: D we can rewrite BE (0) as follows. 5+B₁ (0) A 6 5 + Bo (1) Ⓒ5 Boll @ 5B₁ (0) non of these.
A: Note: As per our company guidelines I am supposed to do only the first question. Kind repost the…
Q: The triple integral ¹³(12xze²y²) dxdydz is equal to 3(e − 1) - True False O
A:
Q: 2. p → (q^r) -q/:: -p
A: Given : Argument is p=> (q Λ r).......(1) ⌐q........(2) ∴⌐p To find…
Q: 3x-1 x+(4+K) 1. Let z(x): = m(x) = = x- - (K + 5) and n(x) = Answer the following: " (K+7)x 2 a.…
A: “Since you have posted a question with multiple sub-parts, we will solve first three sub-parts for…
Q: Evaluate the following integral using change of coordinates: SR S x³ + xy²dady where R is the region…
A:
Q: Employment. According to the U.S. Bureau of Labor Statistics, the number of professional services…
A: Given: The number of professional services employees fluctuated during the period l, as modeled by…
Q: Find Maclaurin series of f(x) = x² + 5x ans: x4 + 5x = 0 + 5x + (0) Select one: O True O False x² 2!…
A: f(x)=x4+5x Maclaurin Series f(x)=∑k=0∞fk0k!xk
Q: conditional proof
A: The given argument is 1. p→q 2. q→r 3. ~r / ∴ ~p
Q: Given the equations: x+y+z=3 x+2y + 3z=-0 x+3y+2z=3 What is the value of x?
A:
Q: You have been breeding roaches in your dorm and are trying to increase the speed in your roach…
A: Given that Population mean (µ) = 4.8 Sec Standard deviation (σ) = 0.34 Sec Bread Sense heritability…
Q: A study showed the following migration matrix, which describes the movement of the population of the…
A:
Q: Calculate the surface integralff, ds, where S is the hemisphere x² + y² + z² = 1, z ≥ 0. The…
A:
Q: Solve using Gaussian Elimination, Given the equation, what is the next step to take? 2x+3y=6 x-y=1/2
A:
Q: Iff: X→ Y is a function and F is a nonempty family of subsets of y, then o(ƒ˜¹ (F¹)) =ƒ˜¹ (0 (F)).
A:
Q: Is this statement TRUE or FALSE? Gaussian Elimination is the process of deriving a simple function…
A: We want to find the given statement is true or false.
Q: generate or sketch of graph y=6x^1/3+3y^4/3 and analyse it
A: Given function is y=6x13+3x43. We have to sketch the graph of the given function. Domain:- Since,…
Q: If w = f(r, s,t), r = x - y, s = y - z, t = z -x then dw дх + aw Əw ду дz + ||
A:
Q: Let x0, x1, ..., Xn be distinct points on the interval [a, b], where Xo <x₂ < x₂ <--- < x₂ and let f…
A:
Q: The vector xin in a subspace H with a basis B=(b, b₂) Find the B-coordinate vector of -18 10 CS…
A:
Q: (0) = r(t) y(t)= Find the solution to the linear system of differential equations 8 and y(0) = 5.…
A:
Q: 450.41 0.24144
A: Angle=13.57°
Q: t ||· || denote the standard Euclidean norm on R². The vector p = ($₂2. - $2₂): is an interior point…
A: Please find the answer in next step
Q: Show whether the two equations y₁ = using the Wronskian. 12e and y2 1.2e are independent or…
A:
Q: Solve using Gaussian Elimination, Given the equation, what is the next step to take? x+y=z=-2 2x - y…
A:
Q: The equation of plane through (3,-1,7) and perpendicular to the vector (4,2,-5) is 4x + 2y5z-25 = 0.…
A:
Q: Solve the equation. 3 2 dx ² = 6x² (9+ y²) An implicit solution in the form F(x,y) = C is = C, where…
A:
Q: Evaluate the following integral using change of coordinates: SR S x³ + xy² dady where R is the…
A: Given Integral, I =∫∫Rx3+xy2dxdy and region R is bounded by, x=16-y2 and x =4-y2 Graphically the…
Q: The figure shows vector a⃗ of magnitude 2 m, and vector b⃗ of magnitude 4 m. Segments OP and SU are…
A: This is the question from vector analysis.
Q: 1. Find the solution of y"" + 4y' = t with initial conditions y(0) = y'(0) = 0 and y'" (0) = 1.
A:
Q: conditional proof
A: We prove the given argument by using rules of inference. We write the rules that applied to…
Q: مممممم م العمل لها -Pre-Hilbert space - Metric space and Complete - Normed space and complet
A: 1) the banach space is solution definition of Banach space A Banach space is a normed linear space…
Q: Solve the equation COSX = X Mumerically using secant approach. Choosing Xo₂0 and X₁ = 0,5 =
A: The secant method uses the formula: xn+2=xn-f(xn)⋅xn+1-xnf(xn+1)-f(xn) to perform the iterations to…
Q: 2. p → (q^r) -q/:: -p
A: Given : Argument is p=> (q Λ r).......(1) ⌐q........(2) ∴⌐p To find…
Q: A = log₁02₁ finy the Value of (25 126 logo C
A:
Q: a 0.9062 Cos (1-√3x) dx = 1/2/2 -0-1 a=0.5968 How?
A: Given ∫-0.1a0.9062 cos(1-3x) dx=12 To Find: a
Q: Find the dimension of each subspace. A. The null space of projection onto a plane in R³ has…
A:
Q: Evaluate the following integral: S² S³²₂ √2+²x+yz dxdydz
A: Given integral is ∫12∫-zz∫2yy+z(x+yz)dxdydz
Q: Z-y+2x = 5 X+y-z = -2 2y + 2z -x=1 What is the value of z?
A:
Q: noon, a large pool contains only 26 gallons of water. A hose is set up so that the pool is filled at…
A: Introduction: We use the term "Rate" to describe the comparison and ratio of two separate…
Q: A startup business began with seven employees, and its size has been doubling every 14 months. (a)…
A:
Q: г 3х +4 x3ux + mt dx I need to solve the integral but not the denominator Ln
A:
Q: Nearly a third can be used to represent
A: We have to show that how a third represent.
Q: 4!+S!
A: Given as, Y=x22!+3!-x33!+4!+x24!+5!-...
Q: Given g = a + w. lgl = 430, pointing in the direction S55°W. W = 1 from the direction S68°E.…
A: give g→=430 point in the direction S550W, w→=100 coming from S680E and a→=g→-w→
Q: Question 9 Let I be the line with parametric equations x=3-3t y = 5+3t z=-6-2t Find the vector…
A:
Q: Sketch the following surface: (z+4)² + (y-1)² = 1 a.) Draw the projection on a xy plane Show…
A: given function z+42+y-12=1 (a) draw projection on xy plane put z=0 42+y-12=1⇒y-12=-15 projection is…
Use the least squares regression to fit a straight line to:
Along with the slope and intercept, compute the standard error of the estimate and the

Step by step
Solved in 2 steps with 2 images

- The data regarding the production of wheat in tons (X) and the price of the kilo of flour in Ghana cedis (Y) Takoradi some years ago were: a. Fit the regression line for the day using the method of least squaresAn owner of a home in the Midwest installed solar panels to reduce heating costs. After installing the solar panels, he measured the amount of natural gas used y (in cubic feet) to heat the home and outside temperature x (in degree-days, where a day's degree-days are the number of degrees its average temperature falls below 65° F) over a 23-month period. He then computed the least-squares regression line for predicting y from x and found it to be ŷ = 85 + 16x. The software used to compute the least-squares regression line for the equation above says that r2 = 0.98. This suggests which of the following? 1. Gas used increases by square root of 0.98 = 0.99 cubic feet for each additional degree-day? 2. Although degree-days and gas used are correlated, degree-days do not predict gas used very accurately. 3. Prediction of gas used from degree-days will be quite accurate.A company that holds the DVD distribution rights to movies previously released only in theaters wants to estimate sales revenue of DVDs based on box office success. The box office gross (in Php millions) for each of 22 movies in the year that they were released and the DVD revenue (in Php millions) in the following year are shown below and stored in a. construct a scatter plot. b. assuming a linear relationship, use the least-squares method to determine the regression coefficients b0 and b c. interpret the meaning of the slope, in this problem d. predict the sales revenue for a movie DVD that had a box office gross of Php75 million..1
- Find the least-squares regression line treating square footage as the explanatory variable. y = (Round the slope to three decimal places as needed. Round the intercept to one decimal place as needed.)A study was conducted to assess the relationship between students’s score in final exam (y) and number of hours spent for exam (x) in each day. Data on a random sample 20 students were obtained and a regression model was estimated; and the least squares estimates obtained are: intercept a=28.5 and slope b=4.3 with SE(b)=Sb=0.017. The SS are: TSS=2540 and ESS=850. ****** QA) What is the difference between exam score obtained by two students one who studied 5 hours and the other who studied 9 hours per day. QB) In the above Question 1, find 95% CI for the slope and interpret it. In the above Question 1, find and interpret the coefficient of determination (r-square value).2. A company that holds the DVD distribution rights to movies previously released only in theaters wants to estimate sales revenue of DVDs based on box office success. The box office gross (in Php millions) for each of 22 movies in the year that they were released and the DVD revenue (in Php millions) in the following year are shown below and stored in (pic) a. construct a scatter plot. b. assuming a linear relationship, use the least-squares method to determine the regression coefficients b0 and b1.
- (a) Compute the least-squares regression line for predicting U.S, emissions from non-U.S. emissions. Round the slope and y-intercept values to four decimal places.Researchers record the fuel consumption of a car y (in miles per gallon) at various speeds x (in miles per hour). Using software, they determine that the least-squares regression line of their data is y^=70.243−0.329x If the observed fuel consumption of the car was y = 49y=49 mpg while moving at a speed of x = 20x=20mph, what would be the error (i.e., residual) in the predicted fuel consumption at this speed found with the least-squares regression line? (Do not round your answer.)An owner of a home in the Midwest installed solar panels to reduce heating costs. After installing the solar panels, he measured the amount of natural gas use y (in cubic feet) to heat the home and outside temperature x (in degree-days, where a day’s degree-days are the number of degrees its average temperature falls below 65F) over a 23-month period. He then computed the least squares regression line for predicting y from x and found it to be, ŷ=85+16x How much, on average, does gas used increase for each additional degree-day? The predicted amount of gas used when the outside temperature is 20 degree- days.
- Use the general equation for the least square regression line to show that this line always passes through the point (x,y) * bars above the x and y.That is, set x=x(with a bar above the x) and show that the line predicts that y=y (with a bar above the y).(g) Compute the sum of the squared residuals for the least-squares regression line found in part (d).A least squares regression line was calculated to relate the length (cm) of newborn boys to their weight in kg. The line is weight=−5.82+0.1601 length. A newborn was 48 cm long and weighed 3 kg. According to the regression model, what was his residual? What does that say about him?