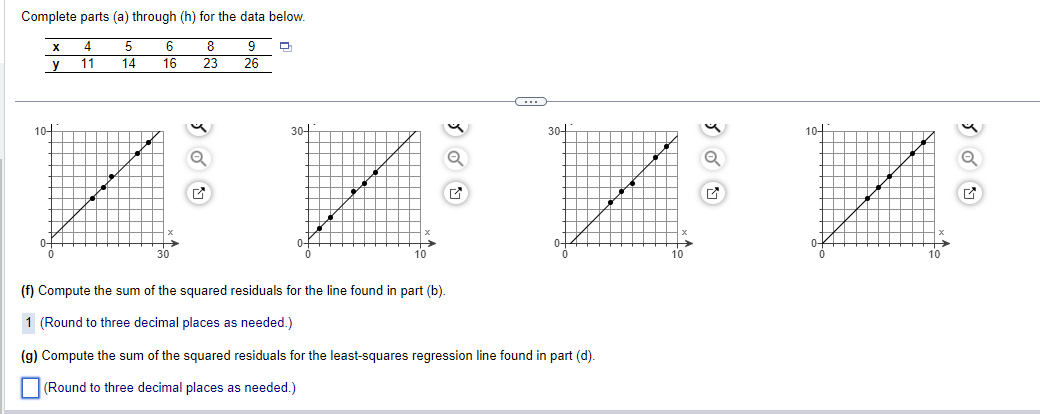
Complete parts (a) through (h) for the data below. X 4 5 6 8 9 О y 11 14 16 23 26 ииии 10 104 0- (f) Compute the sum of the squared residuals for the line found in part (b). 1 (Round to three decimal places as needed.) (g) Compute the sum of the squared residuals for the least-squares regression line found in part (d). (Round to three decimal places as needed.) С


Q: A researcher wanted to determine if carpeted rooms contain more bacteria than uncarpeted rooms. The…
A: Given :
Q: What is the slope of the median-median line for the dataset in this table? y 18 20 15 16 10 6 9 7 11…
A: Introduction: It is required to find the slope of the median-median line for the dataset.
Q: a) Let X₁, X₂, X3,..., X, be a random sample of size n from population X. Suppose that X follows an…
A:
Q: a) Let X₁, X2, X3,..., X, be a random sample of size n from population X. Suppose that X follows an…
A: Given that, X follows exponential distribution with parameter θ.
Q: Which of the multivariate regression parameters listed below would be best interpreted as: the…
A: The multivariate regression equation (y^) = a+b1*x1+b2*x2+.... where y = dependent variable x1,x2…
Q: Use the given data to find the equation of the regression line. Examine the scatterplot and identify…
A:
Q: 6. Suppose that earthquakes occur according to a Poisson process with rate A = 2 and the time unit…
A: Given that: Mean number of occurrences, λ=2 per month
Q: A certain type of battery has a mean shelf life of 5 years with a standard deviation of 5 months. a)…
A: Hi! Thank you for the question, As per the honor code, we are allowed to answer three sub-parts at a…
Q: researcher takes a sample of 40 introverts and 40 extroverts and asks them to solve problems in…
A: Provided data, The results of number of persons solved the problem is given below: Crowded…
Q: Suppose Z follows the standard normal distribution. Calculate the following probabilities using the…
A:
Q: Most soft drink beverages are packaged and sold in 12-ounce cans. You want to test to see how…
A: The given claim is that the mean amount of liquid in coke cansμ1 is less than the mean amount of…
Q: How do i find the test statistic and the p-value?
A: The sample sizes are 22 and 22.
Q: The National High School Health Survey (NHSHS) indicates that about 50% of 12th graders consume less…
A:
Q: Suppose that the number of Facebook friends users have is normally distributed with a mean of 149…
A:
Q: Can I get assistance with the calculations for - Covariance with MP - Correlation with market…
A: State of the economy Probability T-Bills Phillips Pay-up Rubber-made Market-Index Recession 0.2 7…
Q: the three median y-values that would form the summary poin - the dataset in the table. =y 15 16 16…
A: Given dividing above data into 3 segments of 3,4,3 values Y values 1st Segment=15,16,16 2nd…
Q: Let X₁, X2, X3,..., Xn denote a random sample of size n from the population distributed with the…
A: Given that X1, X2, X3, . . ., Xn denote a random sample of size n from the population with the…
Q: I want to explain these tables in detail
A: The table contains the result of independent samples t-test in SPSS. This test is used to compare…
Q: Refer to the accompanying data set and construct a 90% confidence interval estimate of the mean…
A:
Q: a) Let Y be a random variable whose probability density function and cumulative distribution…
A: The level of significance is equal to probability of type I error. The power of test is rejecting H0…
Q: What is the t-statistic for the sample mean difference? B) How many degrees of freedom are there…
A: From the given information we conduct hypothesis test.
Q: A study compared floral diversity between croplands and wetlands. Independent random samples of 120…
A: Obtain the 99% confidence interval for the difference in mean number of floral species between…
Q: Consider a drug that is used to help prevent blood clots in certain patients. In clinical trials,…
A:
Q: QUESTION 24 The coefficient of correlation O a. is the square of the r-square. O b. is the square…
A: A correlation coefficient tell us about the association between two variables and the value of…
Q: The mean SAT score in mathematics is 530. The founders of a nationwide SAT preparation course claim…
A: given data ,themean SAT score in mathemeticas =530claim :the founders of a nationwide SAT…
Q: 2. We wish to analyze the monthly water usage of a production plant, Y (in gallons), with respect to…
A: Hello! As you have posted more than 3 sub parts, we are answering the first 3 sub-parts. In case…
Q: It has been observed that some persons who suffer renal failure, again suffer renal failure within…
A: The information provided in the question are as follows : Let p1 represents the population 1 and p2…
Q: You wish to test the following claim (H) at a significance level of a = 0.10. H₂:₁ = 1₂ Ha: ₁ > ₂…
A: The question is about hypo. testing Given : Randomly selected sample from popl. 1 ( n1 ) = 21 Mean…
Q: The owner of a new pizzeria in town wants to study the relationship between weekly revenue and…
A: Formula used: Coefficient of determination R2 R2 = (TSS - RSS) / TSS
Q: Pew Research surveyed a random sample of 1,313 U.S. adults in 2011. They asked them: "How important…
A: Introduction This test is a chi-square test which is a non-parametric test.
Q: 5. (a) Derive the distribution of the number of Bernoulli trials required to get r successes. (b)…
A: Suppose there is a series of independent Bernoulli trials with a success rate of p for each trial.…
Q: Use the given statistics to complete parts (a) and (b). Assume that the populations are normally…
A:
Q: A study was done using a treatment group and a placebo group. The results are shown in the table.…
A: The claim that the two samples are from populations with the same mean. H0:μ1=μ2 H1:μ1≠μ2
Q: (c) Determine the linear correlation coefficient between square footage and asking price. r= (Round…
A: Given data is Square Footage , x Selling Price y 2306 396 3154 370.6 1093 184.4 1926…
Q: A one-sample test of H0: μ = 125 against Ha: μ > 125 is carried out based on sample data from a…
A: The population standard deviation is 15.
Q: The mean age of De Anza College students in a pre thinks the mean age for online students is older…
A: Given, sample size (n) = 56 sample mean (x̄) = 29.4 sample standard deviation (s) =2.1 population…
Q: In a recent court case it was found that during a period of 11 years 864 people were selected for…
A: given data claim : p < 0.789n = 864p^ = 0.36α= 0.05
Q: What is Tschuprow's coefficient?
A: Given that We have define the Tschuprow's coefficient
Q: QUESTION 34 A measure of identifying the effect of an unusual x value on the regression results is…
A: It is given that the statement related to the regression analysis. Here, need to find out the…
Q: Suppose you wish to find out the answer to the age-old question, "Do people prefer Cola 1 or Cola…
A: Given the sample size n = 100 Let X be the number of persons prefer cola 2 = 51 p = proportion of…
Q: d. For the group of 41 movies, find the probability that the average production cost is between 54…
A: The mean is 58 and the standard deviation is 20.
Q: Instructions: Show & explain well your work. 1. Connor McDavid counted 16 goals out of 79 shots. A)…
A: Let there are n trials and each having two outcomes - Success and Failure. The trials are…
Q: The amount of pollutants that are found in waterways near large cities is normally distributed with…
A: As per our guidelines we can solve first three sub part of question and rest can be reposted.…
Q: An engineer wants to determine how the weight of a car, x, affects gas mileage, y. The following…
A:
Q: Answer all 4 parts please
A: Given data: New process Old process 55 60 62 61 64 66 66 65 68 59 61 64…
Q: hypothesis H₁:0 = 1 using one random observation Y. i) Find the level of significance which rejects…
A: The level of significance is equal to the probability of type I error. The power of test is…
Q: Researchers measured skulls from different time periods in an attempt to determine whether…
A: Solution: Given information: n1=30 Sample size of 4000 B.C n2=30 Sample size of A.D 150 s1= 5.16…
Q: Two samples, each with n = 5 scores, have a pooled variance of s²p = 40. What is the estimated…
A: Solution-: Given: n1=n2=5,sp2=20 We want to find the estimated standard error for the sample mean…
Q: where y = Bo + B₁x₁ + ₂x₂ + 3x3 + E X₁ = number of competitors within one mile X₂ = population…
A: Given regression equation is, y^=10.9-4.2x1+6.8x2+15.9x3
Q: The test statistic of z=1.49 is obtained when testing the claim that p > 0.3. a. Identify the…
A: given data, Z=1.49claim p.0.30we have to find out the type of test statistics, p-value and…

Step by step
Solved in 2 steps

- For a sample of 15 rural counties in one state, a researcher has collected information about the rate of deaths due to traffic accidents per 1,000,000 population and the percentage of the population which consists of males, age 16 to 25. For these variables, find the least squares regression line and compute r and r squared. Write a sentence or two summarizing and explaining your results. RATE OF % OF POPULATION County Traffic Deaths Young Males County Traffic Deaths Young Males A 15 4 B 16 5 C 22 10 D 23 9 E 20 8 F 25 11 G 18 2 H 15 6 I 19 12 J 10 3 K 9 2 L 18 15 M 15 9 N 24 16 O 9 3while using the t-test to test whether regression is significant, in the model yi=β0+β1xi+εiyi=β0+β1xi+εi, what is the calculated student-t statistics (H0:β1=0H0:β1=0 versus H1:β1≠0H1:β1≠0). Calculate the least squares estimates of β0β0 in the model yi=β0+β1xi+εi Calculate the sum of squares of y denoted by Syy , the sum of squares of x denoted by Sxx and sum of squares (products) of x and y denoted by Sxy while using analysis of variance (ANOVA) to test whether regression is significant, in the model yi=β0+β1xi+εiyi=β0+β1xi+εi, what is the residual or error sum of squares due to regression, SSE. kindly help with this questionAdvertising share x and market share y fir a particular brand of cigarettes were sampled at ten randomly selected year. Summary information is: n = 10, Ex = .688, Ex2 = .050072, Ey =.835, Ey2 = 0.079491, Exy = .060861 a) Compute the least squares regression line b) Find the coefficient of determination r2 and explain what it means in the context of this problem. c) Compute a 90% prediction interval for market share when advertising share is .07(7%)
- 2. A company that holds the DVD distribution rights to movies previously released only in theaters wants to estimate sales revenue of DVDs based on box office success. The box office gross (in Php millions) for each of 22 movies in the year that they were released and the DVD revenue (in Php millions) in the following year are shown below and stored in (pic) a. construct a scatter plot. b. assuming a linear relationship, use the least-squares method to determine the regression coefficients b0 and b1.For a sample of 15 trees, the volume of lumber (y) (in cubic meters) and the diameter (x) (in centimeters) at a fixed height above ground level was measured. The following summary statistics were obtained: x̄ = 35.2 sx = 8.9 ȳ = 0.78 sy = 0.48 r = 0.95 a) Compute the least-squares regression line for predicting volume from diameter. B)Predict the volume for a tree whose diameter is 42 centimetersA study of IT companies has found the following data on the age of each company and its annual volume of sales: Age (years) Sales (000) 2 22 2.5 34 3 33 4 37 4.5 40 4.5 45 5 49 3 30 6 58 6.5 58 (a) Determine the least squares regression that relates the age of company variable to the sales variable in the form y = a + bx. (b) Provide a practical interpretation of the coefficients a and b. (c) Determine the ‘goodness of fit’ (R2) of the estimated regression line. d) Using the estimated regression line determined in (a), calculate what volume of sales would be predicted for a company that is 3.5 years of age. (e) If it was found that…
- 6/15 For the data set below: determine The least squares regression line. Round to two decimal places as needed. Compute the sum of the squares residuals for theyears Xi bonus Yi XiYi Xi2 4 5.7 22.8 16 2 3.5 7 4 7.4 10.1 74.74 54.76 5 9 45 25 2 2.7 5.4 4 12 12 144 144 Question 24 Are years of service and annual bonuses related? The annual bonuses of 6 randomly selected employees (measured in “thousands of dollars”) along their their respective years of service for the company. Suppose we estimate a linear regression using the Ordinary Least Squares technique of the form: Bonusi = b0 + b1(yearsi) where the subscript i indicates the ith employee The data is reproduced above for this experiment. Please calculate the standard error of the estimate, or s, for the regressionyears Xi bonus Yi XiYi Xi2 4 5.7 22.8 16 2 3.5 7 4 7.4 10.1 74.74 54.76 5 9 45 25 2 2.7 5.4 4 12 12 144 144 Question 25 Are years of service and annual bonuses related? The annual bonuses of 6 randomly selected employees (measured in “thousands of dollars”) along their their respective years of service for the company. Suppose we estimate a linear regression using the Ordinary Least Squares technique of the form: Bonusi = b0 + b1(yearsi) where the subscript i indicates the ith employee Using your excel output from this regression, what is the correct decision using the p value method for the slope test (assume an alpha level of .05) H0: B1 = 0 (not a linear relationship) H1: B1 ≠ 0 (is a linear relationship) a) a. fail to reject the null hypothesis, there is insufficient evidence of a linear relationship b) b. fail to reject the null hypothesis, there is sufficient evidence of…
- A random sample of 65 high school seniors was selected from all high school seniors at a certain high school. The following scatterplot shows the height, in centimeters (cm), and the foot length, in cm, for each high school senior from the sample. The least-squares regression line is shown. The computer output from the least-squares regression analysis is also shown. Term Coef (SE) Coef T-Value P-Value Constant 105.08 6.00 17.51 0.000 Foot length 2.599 0.238 10.92 0.000 S=5.90181 R–sq=65.42% (a) Calculate and interpret the residual for the high school senior with a foot length of 20cm and a height of 160cm. (b) The standard deviation of the residuals is s=5.9. Interpret the value in context. (c) The following histogram summarizes the 65 residuals. Assume that the distribution of residuals is approximately normal with mean 0cm and standard deviation 5.9cm. What percent of the residuals are greater than 8cm? Justify your answer.…A random sample of 65 high school seniors was selected from all high school seniors at a certain high school. The following scatterplot shows the height, in centimeters (cm), and the foot length, in cm, for each high school senior from the sample. The least-squares regression line is shown. The computer output from the least-squares regression analysis is also shown. Term Coef (SE) Coef T-Value P-Value Constant 105.08 6.00 17.51 0.000 Foot length 2.599 0.238 10.92 0.000 S=5.90181 R–sq=65.42% (a) The following histogram summarizes the 65 residuals. Assume that the distribution of residuals is approximately normal with mean 0cm and standard deviation 5.9cm. What percent of the residuals are greater than 8cm? Justify your answer. (b) Based on your answer to part (a), would it be surprising to randomly select a high school senior from the high school with a foot length of 20cm and a height greater than 165cm? Justify your answer.A random sample of 65 high school seniors was selected from all high school seniors at a certain high school. The following scatterplot shows the height, in centimeters (cm), and the foot length, in cm, for each high school senior from the sample. The least-squares regression line is shown. The computer output from the least-squares regression analysis is also shown. Term Coef (SE)Coef T-Value P-Value Constant 105.08 6.00 17.51 0.000 Foot length 2.599 0.238 10.92 0.000 S=5.90181 R–sq=65.42% (a) Calculate and interpret the residual for the high school senior with a foot length of 20cm and a height of 160cm.
