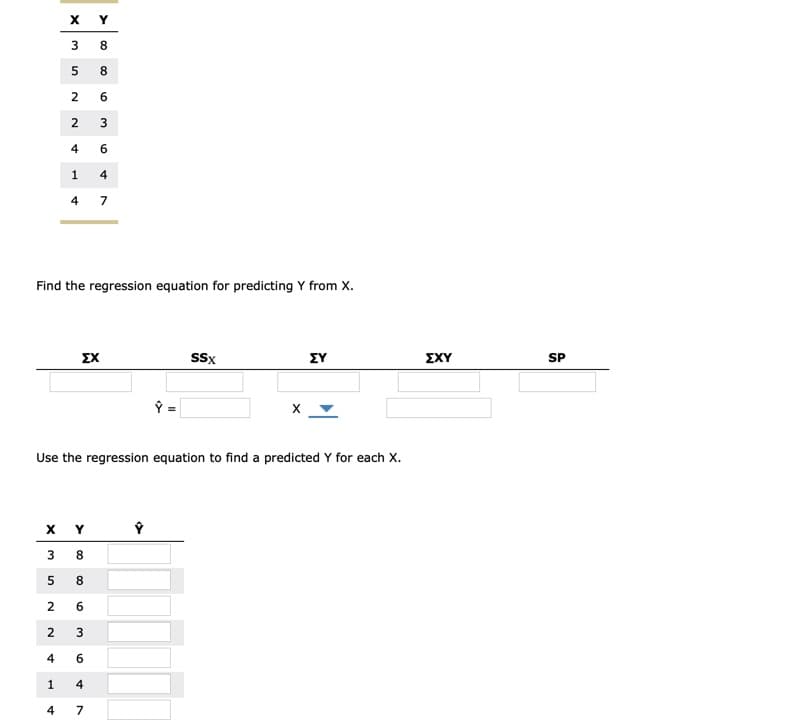
X Y 8 8 4 6 4 7 Find the regression equation for predicting Y from X. Σχ SSx ΣΥ ΣΧΥ SP 6. 3. 3. 2. 2. 1.


Q: According to a food website, the mean consumption of popcorn annually by Americans is 64 quarts. The…
A: Given that
Q: For this exercise, round all regression parameters to three decimal places. The following table…
A: Solution given below i
Q: 12 female and 7 male students take Mathematics course. While 3 of the female students do not have a…
A: When there is a chance of uncertainty, we find the probability. Probability is, mathematically,…
Q: In a random sample of 8 people, the mean commute time to work was 35.5 minute and the standard…
A: Given n=sample size=8, sample mean x̄=35.5, s=7.3, population standard deviations σ=9.3
Q: person each day. Death rates are measured as the annual number of deaths per 100.000 people. In…
A: Given Information: The details regarding the scatterplots are given.
Q: For an analysis of variance comparing six treatment means with a separate sample of n = 7…
A: From the provided information, Number of treatment (k) = 6 Number of participants in each treatment…
Q: In a program designed to help patients stop smoking, 179 patients were given sustained care and…
A: We perform one-proportion hypothesis test to test the claim about a population proportion.
Q: A company wishes to purchase one of five different machines: A, B, C, D, or E. In an experiment…
A:
Q: A seven-question quiz has 4 true/false questions followed by 4 multiple choice questions. For each…
A:
Q: The number of chocolate chips in a popular brand of cookie is normally distributed with a mean of 19…
A: Given that. Mean=19 Standard deviation=1.6 Find P(a<X<b)=90%
Q: 22. Test the adequacy of the linear model using the coefficient of determination. a. The linearity…
A: From output we see that, Coefficient of determination = R-sq = 42.86% Which is not adequate. If…
Q: Compute the lower bound of an 85% confidence interval for the population mean of the random variable…
A: Given: sample size, n = 18 confidence level, c = 85% = 0.85
Q: 1. What are the dependent/ independent variables in a correlational study of ice cream sales and air…
A: Here we want to know dependent and independent variable.
Q: For the following data please, d) give information about the skewness of the distribution e) plot…
A: Given Data: 55, 59, 57, 59, 58, 60, 57, 56, 58, 61, 58
Q: The recidivism rate for convicted sex offenders is 15%. A warden suspects that this percent is…
A: The random variable X follows normal distribution. We have to test whether the recidivism rate for…
Q: 2. The numbers of service calls a heating company made during the first 10 days of October are…
A:
Q: researcher was interested in the effect of outdoor acitivity on mood.She hypotheszied that people…
A: *Answer: The independent variable is outdoor activity. The dependent variable is mood. We have…
Q: Question#1: A student obtained 40,50,60,80 and 45 marks in the subjects of English, Urdu,…
A:
Q: Given M1 = −5, s1 = 4.6, n1 = 72, M2 = − 1, s2 = 3.3, and n2 = 60, calculate t.
A:
Q: IN A Sample you had 6503 out of 8896 voters who Supported a candidate. Test that the proportion of…
A: Given that Sample size n =8896 Favorable cases x =6503 Sample proportion p^=x/n =6503/8896 =0.7310
Q: The following table shows retail sales in drug stores in billions of dollars in the U.S. for years…
A: Hey there! Thank you for posting the question. Since there are multiple questions posted, we will…
Q: Referring to the table below, compute the following: 1. Q1 2. b. Q3 3. c. D7 4. Dg 5. P65 6. P74 Age…
A: Class Frequency 5 - 9 10 10 - 14 16 15 - 19 20 20 - 24 18 25 - 29 14 30 - 34 10…
Q: two-factor, independent-measures research study with 2 levels of factor A and 4 levels of factor B…
A: Given that ; A has two level B has 4 level So, total levels (k) = 2 + 4 = 6 Total observation…
Q: 7. Suppose 222 subjects are treated with a drug that is used to treat pain and 52 of them developed…
A: Given that Hypothesized Population Proportion (p_0)(p0) = 0.200.20 Favorable Cases (X)(X) =…
Q: 3. The registrar wants to know if the average encoding period of time in the school automate is 30…
A: We have given that the two statements about to the null and alternative hypotheses.
Q: A shipment of 7 television sets contains 3 defective sets. A hotel makes a random purchase of 3 of…
A:
Q: A psychology graduate student wants to test the claim that there is a significant difference between…
A:
Q: Listed below are paired data consisting of amounts spent on advertising (in millions of dollars) and…
A: For the given data Find the Linear Correlation Coefficient r = ? Find the p-value p-value = ?…
Q: ramér’s V is used to evaluate effect size for the chi-square test for independence whenever the test…
A:
Q: 2. A researcher claims that the average salary of an engineer in the Philippines is more than…
A: Given that 2) Population mean μ =50700 Sample size n =60 Sample mean =41000 Standard deviation…
Q: Mortgage Status Current Past Due In Foreclosure Repossessed Frequency 136 56 5 3 (The four…
A: It is given that:
Q: county A) thlan Lounty Count le di To e ol S41, 10 In County B, a random sample of 8 residents has a…
A: Given that Sample sizes n1 =18 , n2=8 Sample standard deviation s1=8200 s2=5900 NOTE:- According to…
Q: Frontal Crash Test Rating 3 2 1 0 Frequency 1 10 3 2 (a) Find the relative frequency…
A:
Q: ... 26. A survey of a random sample of 210 male teens and 228 female teens, ages 13 years to 17…
A: We have given that the following statement A random sample of 210 male and 122 females 122 males and…
Q: When the variance for the difference scores is very small, this means that the ______ is/are…
A: Given the statement to fill up: When the variance for the difference scores is very small, this…
Q: Question 15 The data shown below consists of the price (in dollars) of 7 events at a local venue…
A: For the given data ( 15 ) r =? p value =?
Q: how many ways can you invite at least 7 of your 10 friends?
A: Given that Total number friends (n) = 10 Number of friends to invite = At least 7 We know that…
Q: How many individuals are described in this table? How many females were among the respondents? The…
A: We have given that the National Longitudinal Study of Adolescent Health interviewed several thousand…
Q: Using the given Minitab output, answer the questions that follow.
A: The objective is to test the significance of slope.
Q: An analysis of variance produces SSbetween = 75 and MSbetween = 15. In this analysis, how many…
A: An analysis of variance produces SSbetween = 75 and MSbetween = 15. In this analysis, how many…
Q: Find the correlation coefficient using Rank correlation (s
A: here use studying in hour = X marks = Y
Q: Assume that 8 women and 6 men work in a department at a large company. Four committee members are…
A: GivenNo.of women work in a department = 8No.of men work in a department = 6Total no. of memebers =…
Q: You are conducting a test of independence for the claim that there is an association between the row…
A: For the given data perform chi square test
Q: odit graph on desmos -10 A) determine the type of regression which would best "fit" the relation:…
A:
Q: In a survey of 500 drivers from the South, 401 wear a seat belt. In a survey of 360 drivers from…
A: We have given thatX1 = 401n1 = 500p̂ = X1/n1 = 401/500 = 0.802X2 = 272n2 = 360p̂2 = X2/n1 = 272/360…
Q: Which of the following represents a 98 percent confidence interval for the slope of the…
A: here given slope of regression line = 0.161 standard error of slope = 0.073 confidence level 98%…
Q: Delicacies Above the Rest, a high-end United States based restaurant in Montego bay, used regression…
A: Regression analysis is useful in predicting value of a response variable, for a given value of the…
Q: 5 4月21日周四 28. An environmental group wanted to estimate the proportion of fresh produce sales…
A: We have given the following statement about the proportion.
Q: Q2. There is a claim that the average height of the students in a university is 155cm. A researcher…
A:
Q: Here is some information to help you with your Z-test. "anırA-d • The value of the test statistic is…
A:


Trending now
This is a popular solution!

Step by step
Solved in 3 steps with 2 images

- XYZ Corporation Stock Prices The following table shows the average stock price, in dollars, of XYZ Corporation in the given month. Month Stock price January 2011 43.71 February 2011 44.22 March 2011 44.44 April 2011 45.17 May 2011 45.97 a. Find the equation of the regression line. Round the regression coefficients to three decimal places. b. Plot the data points and the regression line. c. Explain in practical terms the meaning of the slope of the regression line. d. Based on the trend of the regression line, what do you predict the stock price to be in January 2012? January 2013?Let x be the size of a house (in square feet) and y be the amount of natural gas used (therms) during a specified period. Suppose that for a particular community, x and y are related according to the simple linear regression model with the following values. ? = slope of population regression line = 0.016 ? = y intercept of population regression line = −7 Question: Graph the population regression line by first finding the point on the line corresponding to x = 1,000 and then the point corresponding to x = 2,000, and drawing a line through these points.Consider a simple linear regression model Y=α+βX+ε. We have collected 15 samples, from which we calculated the summary statistics ∑xi=66, ∑x2i=6568, ∑yi=459, ∑y2i=27933, ∑xiyi=11311. Suppose one of the data is supposed to be (x1=10, y1=30), but is incorrectly recorded as (x1=7, y1=34). All other observations are correctly recorded. What is the OLS estimators αˆ= ? and βˆ= ? based on the correct data.
- A linear regression line y = 80 + 0.2x is computed to predict the final exam score y on the basis of the first score x on the first test. Suppose Maria scores a 95 on the first test. What would be the predicted value of her score on the final exam? STEP 1: Substitute the value of the first test into the equation of the linear regression line. y = 80 + 0.2 STEP 2: Solve the equation of the linear regression line.y =The regression model Yi=−303.8+1.5949X1i−0.0699X2i predicts standby hours based on total staff present, X1i, and remote hours, X2i, for week i. The data from which the model was constructed are provided. b. If appropriate, perform the Durbin-Watson test, using α=0.05. Determine the Durbin-Watson statistic.Suppose that a regression relationship is given by the following:Y = β0 + β1X1 + β2X2 + εIf the simple linear regression of Y on X1 is estimated from a sample of n observations, the resulting slope estimate is generally biased for β1. However, in the special case where the sample correlation between X1 and X2 is 0, this will not be so. In fact, in that case the same estimate results whether or not X2 is included in the regression equation.a. Explain verbally why this statement is true.b. Show algebraically that this statement is true.
- If the regression constant is 9.1410114235and the regression coefficient is 0.90613879. Present the data in a textual manner. Just presentation; no need for calculation please. Note: A college faculty collected data on his students’ general weighted average (Y) in the first semester and their high schoolaverage grade (X).A linear multiple regression model is given as: Y = βo + β1 X1 + β2 X2 + μ a. Determine the parameters of this model b. Explain the circumstance under which X1 be called an endogenous variable?A fitted linear regression model is (y=10+2x ). If x = 0 and the corresponding observed value of y = 9, the residual at this observation is:
- he following estimated regression model was developed relating yearly income (y in $1000s) of 30 individuals with their age (x1) and their gender (x2) (0 if male and 1 if female).ŷ = 30 + 0.7x1 + 3x2Also provided are SST = 1200 and SSE = 384. The yearly income of a 24-year-old female individual isThe regression equation is calculated to be y' = 5.333 + 0.777x. After conducting a hypothesis test, your decision is to fail to reject the null hypothesis. Predict the value of y' when x=11. A researcher wants to determine if the number of years of education for a parent correlates with the number of years of education for their child. The table shows the number of years of education of the parent and the number of years of education of their child for a random sample of 7. Years of Education of Parent 13 9 12 10 12 10 12 Years of Education of their Child 15 11 10 16 17 12 17 The regression equation is calculated to be y' = 5.333 + 0.777x. After conducting a hypothesis test, your decision is to fail to reject the null hypothesis. Predict the value of y' when x=11. 5.333 13 14 13.88In a statistics course, a linear regression equation was computed to predict the final-exam score from the score on the first test. The equation as ˆ y = 14 + 0.5 x y ^ = 14 + 0.5 x where y is the final-exam score and x is the score on the first test. Andrea scored 75 on the first test. What is the predicted value of the Andrea's score on the final exam? Andrea scored 56.5 on the final exam. What is the value of the residual?
